Is there a working software package that will show cpu usage and network speed up/down?
I compile the deepin ones in AUR without error but they don’t show up in the dock even after a reboot. The old app netspeed had both a plasm and a xfce plugin but nothing that will work for deepin.
As a last resort does anyone have a working conky configuration with cpu and network speed that works well with deepin?
While I appreciate the reply a text based system monitor isn’t what I’m talking about…if it was I could just run the GUI deeping-system-monitor which shows both cpu and network speed but if you just want something on the desktop or in the dock those are not gonna cut it. A quick “show desktop” would let you look at conky for example so you could see if the cpu is pegged (which on my laptop is rather easy to do).
If you are running MATE DE, there is ‘MATE System Monitor’ that shows resources usage. I think you can install that on other DEs, but you have to find out where it was installed to launch it.
It shouldn’t be hard to find a conky that works - but one that you want running on your desktop is another matter! If you end up wanting that, can you describe how you want it to appear (and where, and what size, and text or graph, and…)
I could easily get you some example code, and perhaps throw the basics together for your spec…
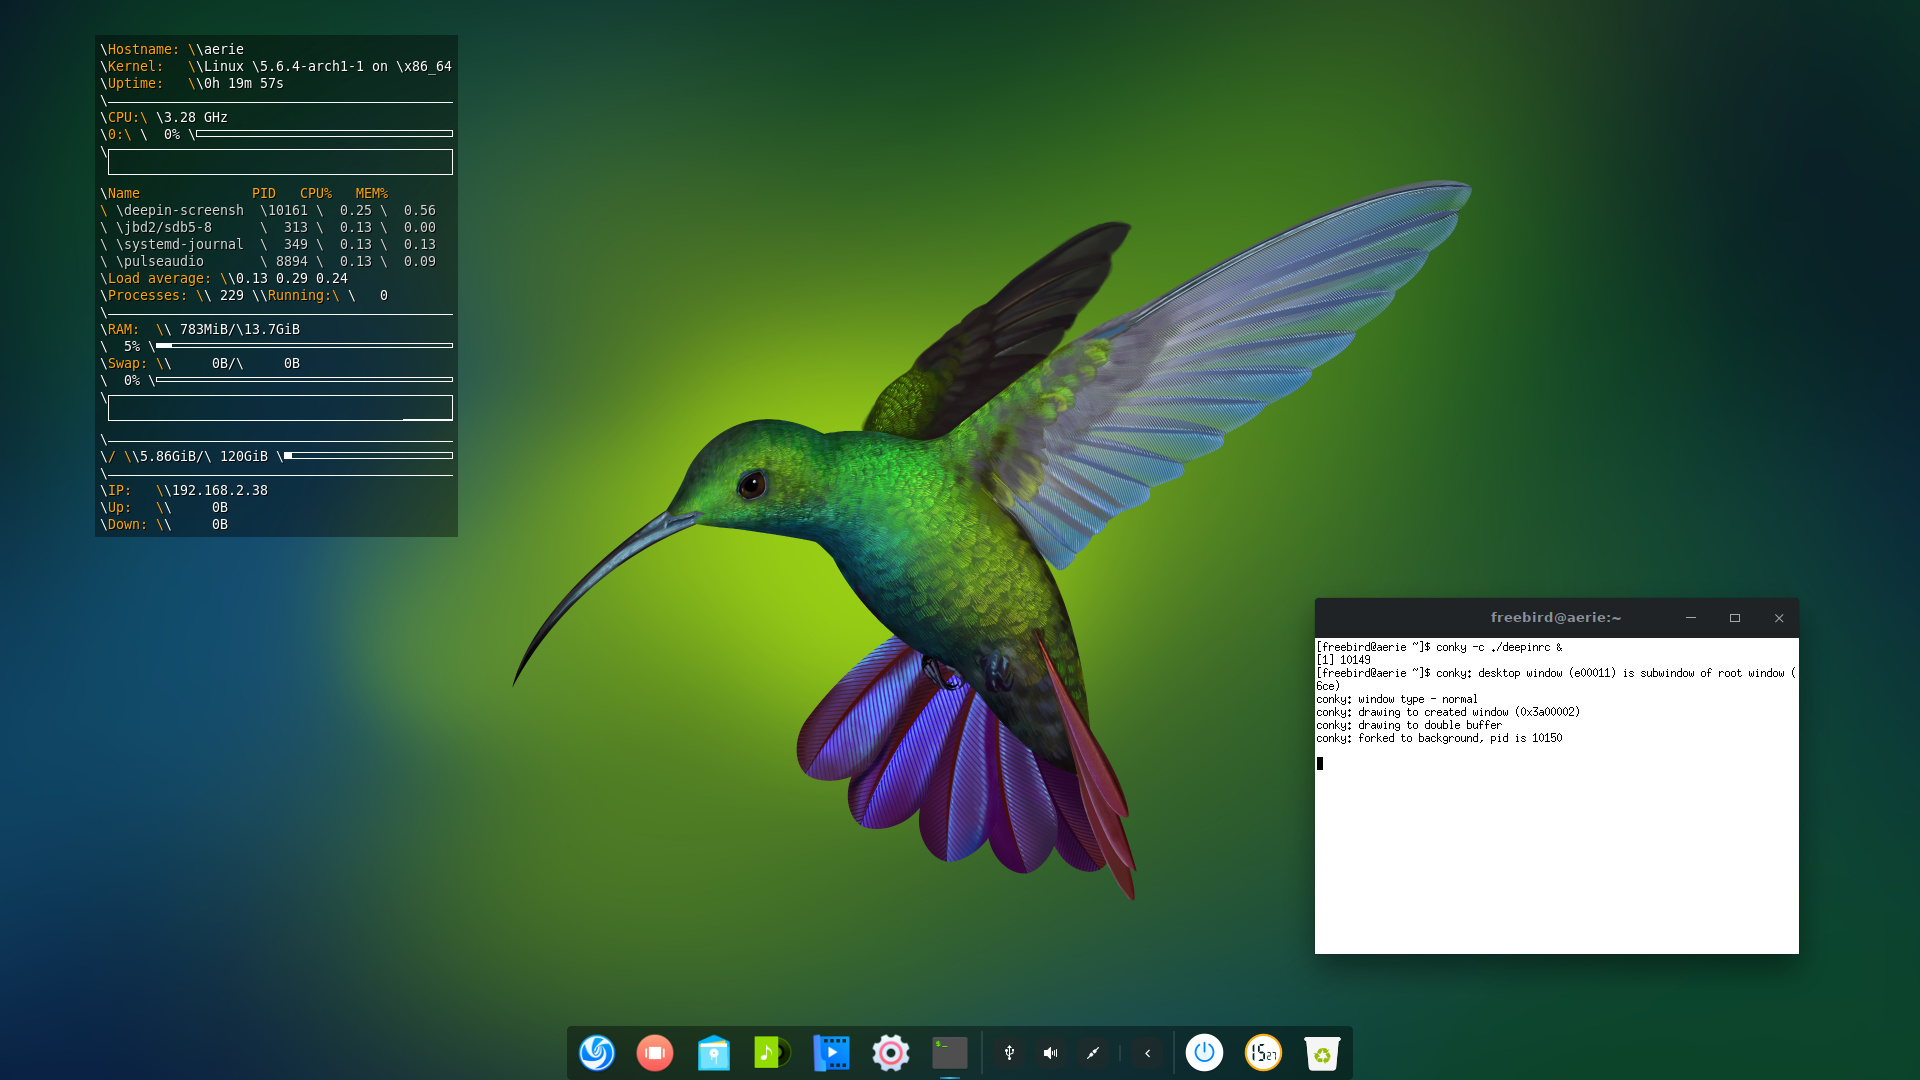
Here’s what I use for each:
and Netstuff
I run the same Conky on Arch and Endeavour (and a few other places!) so it shouldn’t have any trouble with Deepin, but I have not yet migrated it there yet. BTW - the net stuff can be done graphically too.
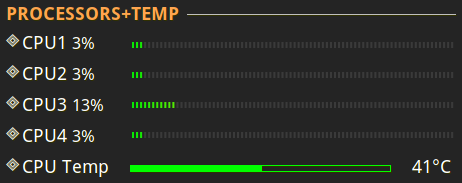
Mostly not (built ins from conky) but the segmented bars are in lua. If I did them in straight conky, they would look more like the temp display. The temp display uses a tiny bash script to test the temp value before display to determine the colour to show (green=normal, red=getting warm).
Also built into conky (but not shown here) is a speed graph for the up and down load stats. I have a whole ‘toolkit’ of lua goodies for displaying weather, clocks, calendars and bar graphs, but most of it can be worked around if not needed/wanted. I think my current desktop setup is visible in "show us your conky’ and/or in “show us your desktop” if you cruise through them (and manage not to be distracted by how many good ones there are).
Seems too complicated for me I think I saw the screenshots of your desktop full of them. They look cool and it’s probably fun setting it all up knowing how to do it
Your display looks fantastic. The last one I used years ago was on the right side of the screen…it showed everything from cpu usage, temp, network, swap usage and even the top cpu use apps. The problem I’m running into is apparently conky changed at some point and many of these older scripts no longer run…I get a message about it trying to convert it and then an error. I did do some googling before asking. I also know how to comment out “extra cpu’s” etc but your skills are lightyears ahead.
Most of the change is in the first, or setup part of the scripts. I think the idea was to harmonize a bit more with lua and its conventions. If you can point me to a copy of your problem script, I may be able to get it going for you - or a reasonable substitute! I also have access to large number of possible scripts, that currently run with conky 1.10 and above - from MX linux and Arcolinux for 2. They ship with a bunch, so I could just raid their conky directories (even from a VBox install, but I have them on the metal here).
Anyway - always happy to try to make more conkys - they make the world a better place (and they are NOT as complicated as they first seem - most of them are setup the same for a given system, and only need changes in the {TEXT} section for what they actually DO). I got my start about 2011 from a huge conky thread over on the Ubuntu forums -and that thread is still going! It remains a good tutrial on how things work, and why, even though the setup syntax has some minor changes.
Athough the music player I use is clementine it usually works with minor changes for amarok configs. I’ll admit i like how you did the bars rather than conky default. I’d be happy to contribute to your paypal if you felt like coming up with a conky deepin users could use “out of the box” whether or not that one works.
The original conky I used was more boxlike and I think it was for opensuse. I have not been able to relocate it but it was all one square top down with cpu usage, ram, swap, wifi and at very bottom was the first 3 or 4 apps using most cpu. It wasn’t overly complicated but would look good on the deepin default desktop. This one is close although the one I used was thinner and longer…smaller font maybe.
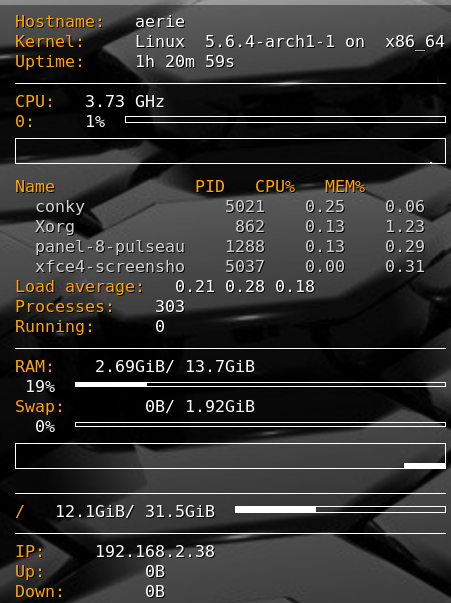
Well - sorry to be so slow - but the Deepin I had loaded wouldn’t let me login! So - I re-installed off the new version, and it came up OK. Anyway - the simple conky you posted above needed very little tweaking - here it is running on a fresh Deepin:
Not sure what all the backslashes are for - but it all works (once I told it where the IP link was (enp3s0 on this system, not the eth0 it was expecting)).
I think those 's are escape characters? Perhaps what you changed affected it as it’s not in original? Could it be a missing font or similar issue? Certainly farther along then I managed. The average user will probably have wlan0 and eth0. I never did find a suitable way to have it auto switch based on which was active short of having two conky’s and using ifup and ifdown hooks to swap them.
I guess they were meant to be - so I just eliminated them all. Here’s the result on my EndeavourOS XFCE - not that it needed any changes!
Any suggestions on improvements? Or should I just cruise through some I have and display them? BTW - here’s the code - as I said - very simple:
So - what’ s missing? How many cores does your CPU have? What disk partitions do you want tracked? Fancy fonts and Endeavour logos? Oh - and for what resolution? If I make 'em for mine, they may be a trifle large for yours! (3840x2160 here)