I’m using KDE with EndeavourOS/Wayland, system details as follows. On startup, I can run chrome browser and a few terminal windows with just 4GB/128 used. After 1-2 days, memory use balloons to all 128GB + 8GB swap, causing crashes and OOM kill events (typically kills my browser, especially during zoom in browser).
System details as follows:
Intel(R) Core Ultra 9 285K, 128GB RAM, 4TB NVME, NVIDIA 3060ti
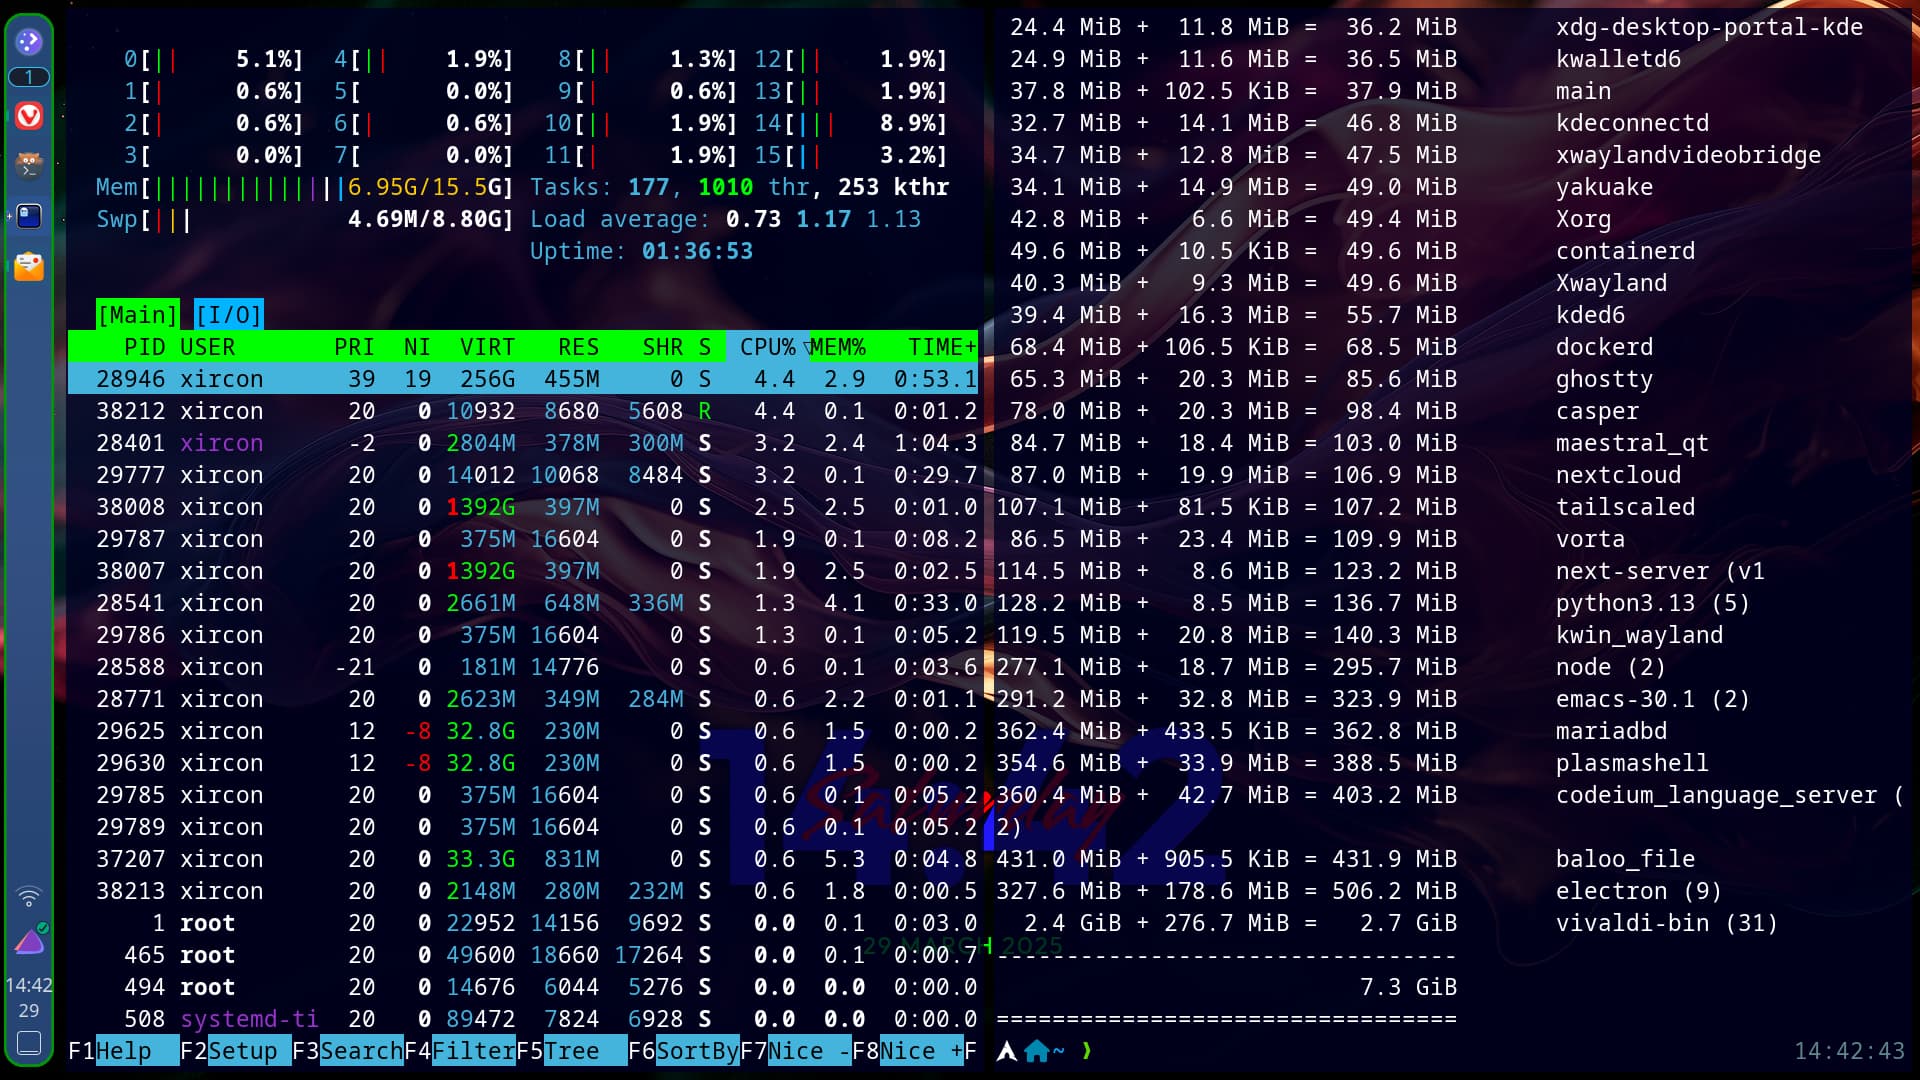
I’ve been checking memory usage in SHR RES and MEM% in htop. After 12 hours plasmashell has 1% MEM, chrome has 0.5, and these are the top processes. free -h gives:
total used free shared buff/cache available
Mem: 125Gi 48Gi 74Gi 525Mi 7.7Gi 80Gi
Swap: 8.0Gi 0B 8.0Gi
Using pmap on the plasma and chrome pids shows these two apps are using basically all of the “used” memory:
pmap --pid 2402 #plasma
total 12497816K (12GB)
pmap --pid 6011 #chrome
total 36033320K (36 GB)
Clearing temps cache seems not to do much.
I’ve removed all extensions from chrome, ensured aur and pacman packages up to date, etc. This has persisted for several weeks, but is an issue now as I’m hoping to transition the PC to always on.
I’ve also tried KDE heaptrack attached to the chrome and plasma pid’s while running. This seems to just hang/does not finish.
Any suggestions to further fix this this or for how to reclaim this memory automatically? Maybe a new user profile? Or, maybe a new desktop envirornment or a move to fedora? this is my sole issue with EOS thus far, otherwise I’d love to stick with it!
I am a KDE Plasma newbie myself but in this situation I would create a new user account and try KDE Plasma a la vanille without any extra installed, addons, widgets, themes etc. so that you could eliminate or confirm that the cause of the issue may be some misbehaving addon or some misconfiguration in your regular user account.
Have you checked if it can be related to your hardware, things like a bug in the BIOS that prevents that your memory gets fully used. Memory not being on the Qvl list of your Motherboard vendor, Things like that. Just a shot in the dark to be honest.
Thanks for the suggestion. As of now (36hr uptime), total used amount in ps_mem is only listed as 7GB, but htop shows 120/128gb of memory used and 5/8GB swap
As I understand it Linux will use available memory for caching. Unused memory is filed with data that may or may not be useful later on. If you look at the colours in the memory bar in htop you will see which part of the memory is filled with cashed data.
This data will be flushed as soon as the memory is needed for other things. I tried to find the source which i used when i read up on this topic (for the same reason as OP), but have not found it yet, and i must now be elsewhere…
That sound a little bit high for just a light browser workload (?), but with 74 GB free that’s totally OK, right?
pmap reports virtually memory, which isn’t relevant when it comes to actual RAM usage.
You have to have some tool open on the side and watch what happens in the OOM situation. With this info alone there isn’t much do deduce. Or check the journal log.
If it stayed at 74GB that would be fine, but it seems to balloon until 99.99% of memory is used (reported in mem -h) causing the OOM and crash issues, (htop is seeming very unhelpful, still showing similar 1-2% memory for chrome or plasma processes as at startup).
It’s helpful to know that pmap results are not so relevant. It just seemed like the only hint to what is “using” so much memory according to htop.
Once the OOM situations are happening, the system is super sluggish and prone to crashing, and so I’ve then had to reboot and grab the logs from boot -1. I can try to do that next time the issue occurs, but would likely need some help interpreting.
Humm, I rememeber something similar. It was some leak in Chromium, when using hardware video decoding. Memory was leaking to Xorg somehow. Was very nasty after few days. Depending on what card / driver you are using it may be something similar.
You could try to disbale hardware acceleration for video decoding and see it it helps. Just your PC can get hooter because of that.
I don’t believe this is related to my issue. I’ve tried clearing the caches. Moreover, when I look at free -h, the cached memory is very low, and clearing it barely changes the situation. The issue seems to be with a memory “leak” where the memory is being used by something and not made available for re-allocation—but htop doesnt show any process using that amount of memory.
Unfortunately, this same with memory use growing and causing crashes still persists on a clean guest account where the only apps open are konsole (htop) and the kde welcome screen, so I don’t think the hardware acceleration fix would help (now I’m thinking Chrome and KDE are unlikely to be the culprits)
This is only after 12hrs or so, so 48G used and 74G free is not yet a problem. But this is growing from an initial <8G used once my workflow apps have started and it becomes ~123G used with only megabytes of free space available within 24hrs of booting.
I’ve tried this on a clean login account (“Guest”) without opening chrome or any browser, and the memory still balloons eventually. So I don’t think it could be chrome at this point. Will monitor with ps_mem and post output