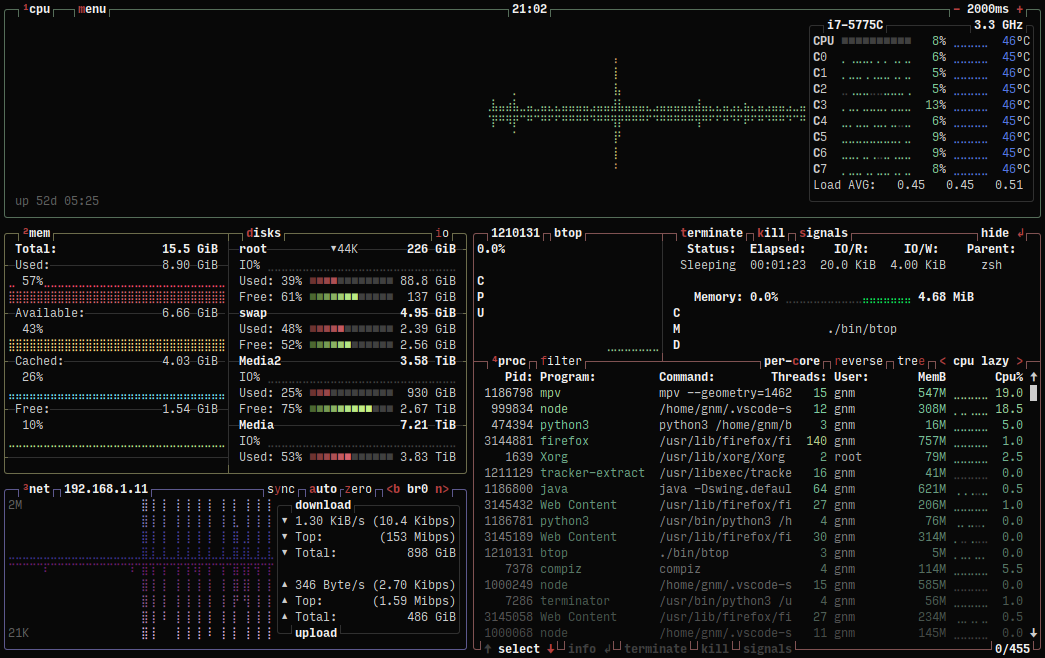
No so recently but it is my favorite ‘top’ app - btop
12 Likes
Yeah I’ve been using btop for the past 8 months or so. love the ease of it.
3 Likes
was using glances and top in the past. btop looks so much better to me ![]()
1 Like
Yeah. I like Btop a lot, too. Lots of things to explore. And I’ve yet to really dig into any configs or options and such.
3 Likes
@HITMAN @thefrog @UncleSpellbinder
What makes this different then HTOP? Better sys reporting? Got me curious.
Don’t know, to be honest. Seems similar to Htop on their respective default pages. For me it’s just easier to view. Easier to navigate.
1 Like
It looks better and more modern than htop for all your ricing screenshots ![]()
3 Likes
it is pretty customizable even more so than I know how to do as I haven’t spent enough time reading the documentation.
3 Likes
Btop is too Graphical i stick to top ![]()
1 Like
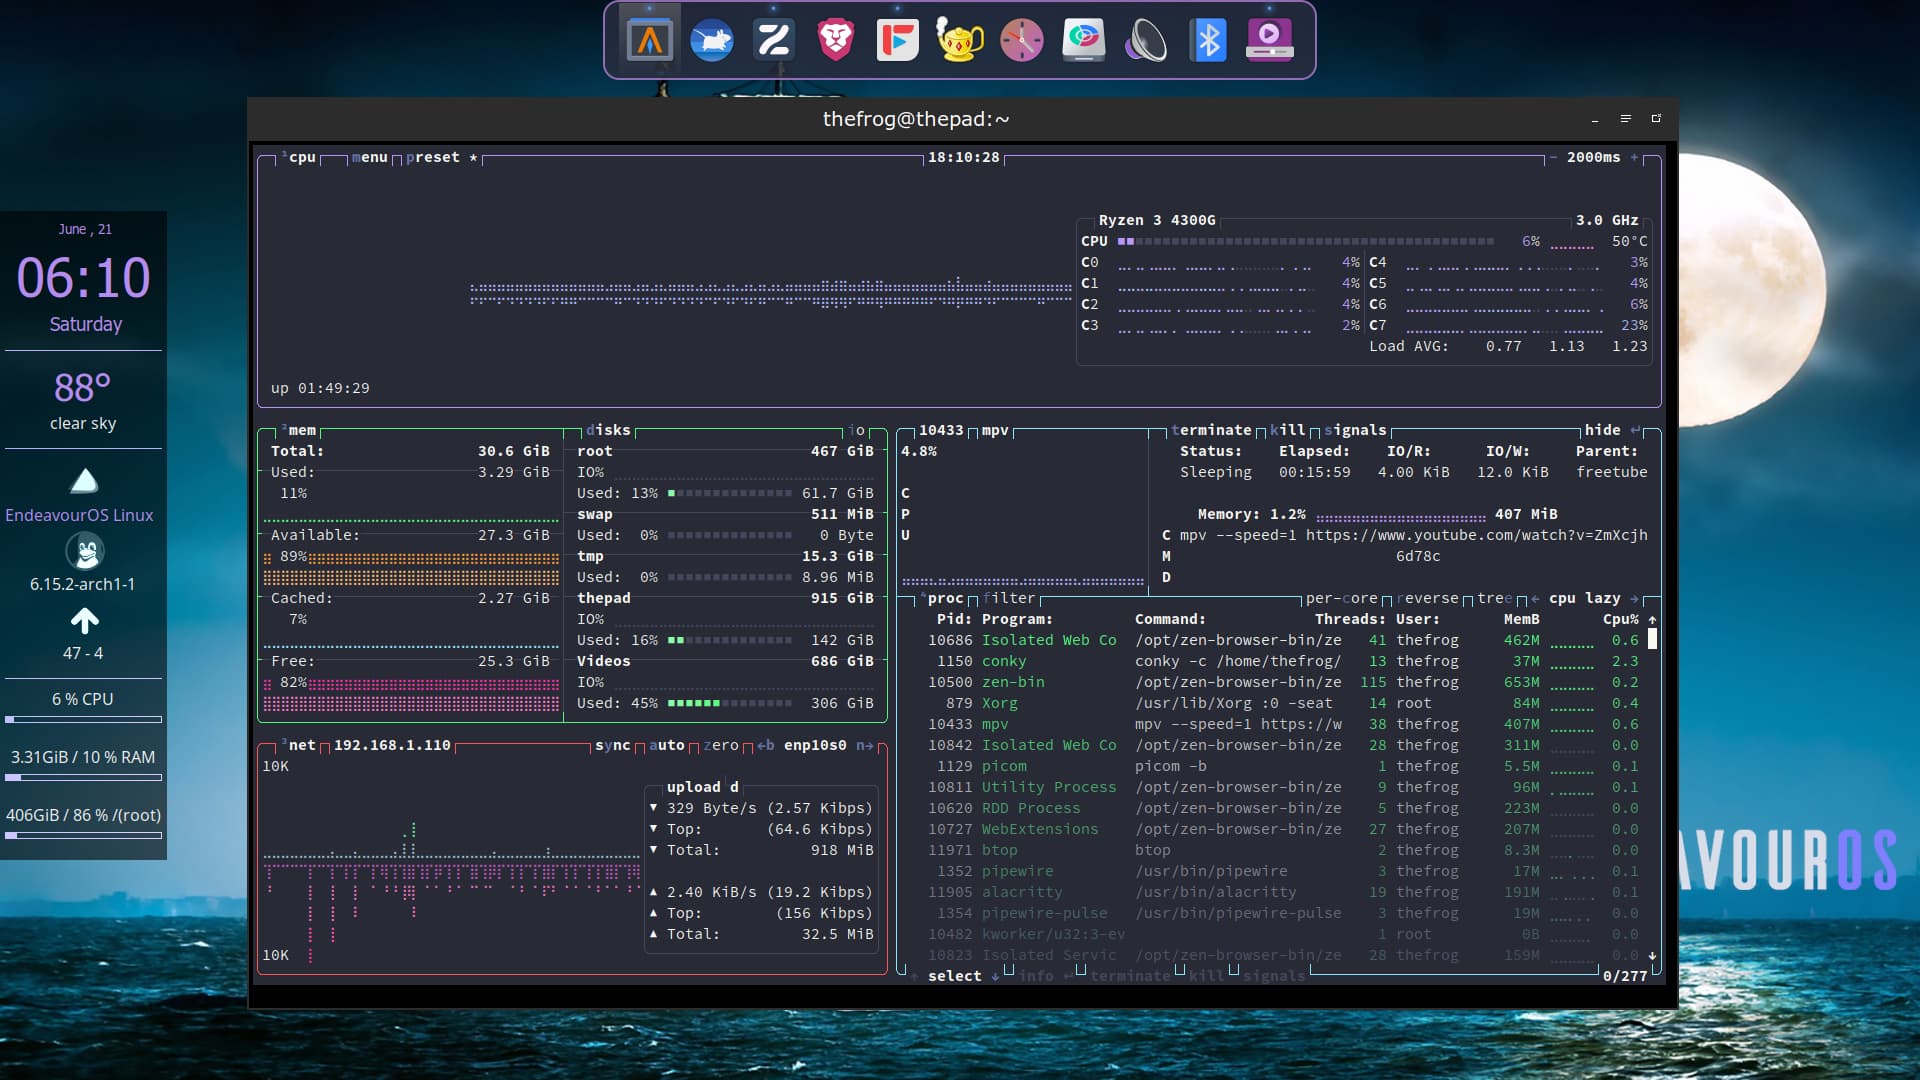
It’s OK, thank you. It’s a lot more organized than htop with elements separated in panes instead of htop’s big clusterf. After install and launch it told me Alacritty was the ‘wrong size for viewing’ their data then proceeded to show me what appeared to be a very low-resolution version of themselves.
I will not edit my Alacritty .toml (.config) to make BTOP happy but it was cooler looking than htop.
I use Alacritty and never had this hmmm maybe I set a size and dont remember lol
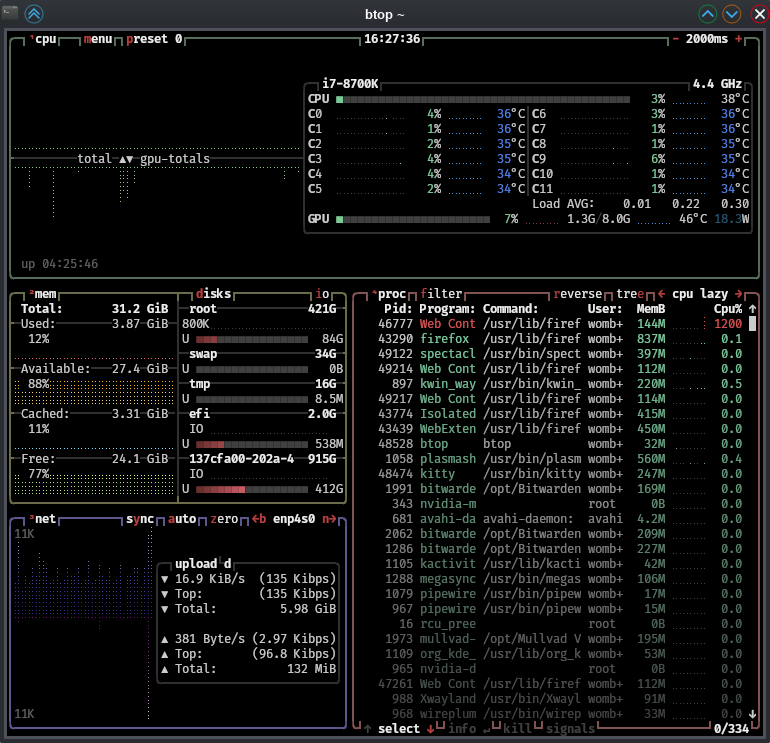
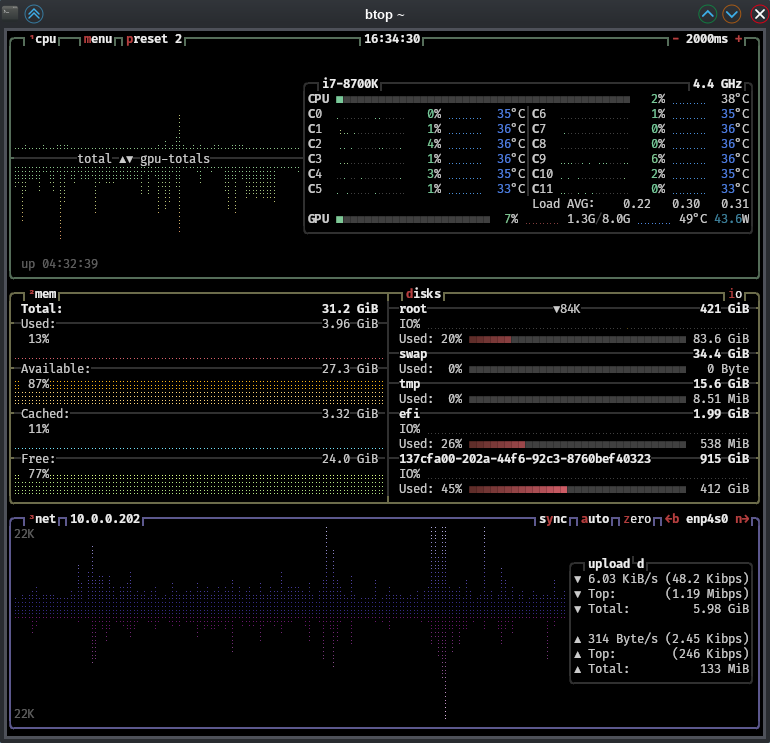
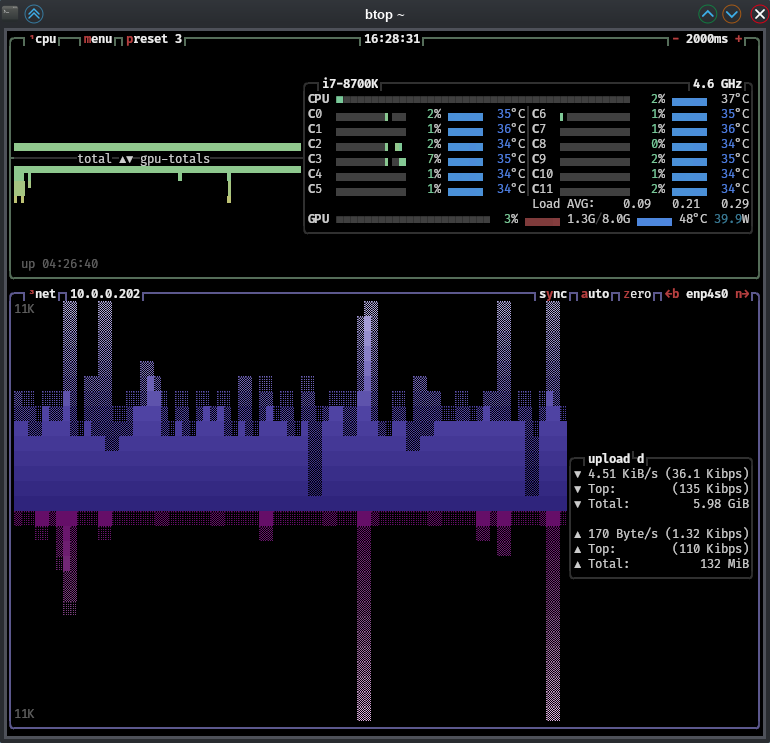
here it is with the dracula theme.
2 Likes
htop vs btop: Key Differences and Comparison
User Interface and Visuals
-
htop offers a clean, color-coded, text-based interface focused on clarity and practicality. It improves on the classic
topwith better organization, mouse support, and customizable columns, making it easy to navigate and use for quick system checks -
btop features a modern, visually rich interface with real-time graphs for CPU, memory, network, and disk I/O. Its design is highly polished, with themes, smooth animations, and a more engaging user experience. btop is generally considered more visually appealing and beginner-friendly due to its intuitive layout
Features
-
htop is known for its practical utility: it provides real-time monitoring of CPU, memory, and process management, with the ability to send signals to processes, sort/filter, and use mouse interaction. It is lightweight and ideal for quick, no-frills monitoring
-
btop expands on this with additional features such as:
-
Real-time graphical displays for system metrics
-
Detailed disk I/O and network usage graphs
-
GPU monitoring (where supported)
-
Extensive customization (themes, layouts, metric selection)
-
Full mouse support and easy navigation
-
Tree view of processes and detailed stats for selected processes
Resource Usage and Performance
-
htop is lightweight and fast, making it suitable for older systems or environments where minimal resource consumption is critical
-
btop is slightly more resource-intensive due to its graphical elements, but remains efficient on modern hardware. It is written in C++ (as btop++), making it lighter and faster than its predecessors (bashtop, bpytop)
Customization
-
htop allows basic customization, such as adjusting columns and sorting options
-
btop provides advanced customization, including themes, layouts, and the ability to show/hide specific metrics, making it appealing for users who want a personalized monitoring experience
Process Management
- Both tools support sending signals (e.g., SIGTERM, SIGKILL) to processes and filtering the process list. htop is often praised for its practical process management features, while btop offers a more interactive and visually guided approach
Use Cases
Choose htop if:
-
You need a fast, lightweight, and practical tool for real-time monitoring.
-
You prefer a simple, text-based interface.
-
You are working on older hardware or minimal environments
-
Choose btop if:
-
You want an aesthetically pleasing tool with advanced metrics and real-time graphs.
-
You value customization and a modern user experience.
-
You are on modern hardware and can accommodate slightly higher resource usage
| Feature | htop | btop |
|---|---|---|
| UI Style | Functional, color-coded | Modern, graphical, themed |
| Customization | Basic | Extensive |
| Resource Usage | Very low | Low–moderate |
| Mouse Support | Yes | Yes (full) |
| Graphs/Visuals | Minimal | Real-time, detailed graphs |
| Disk/Network Stats | Basic | Detailed, with trends |
| GPU Monitoring | No | Yes (where supported) |
| Process Management | Excellent | Good |
| Best For | Practical, quick checks | Visual, in-depth monitoring |
10 Likes
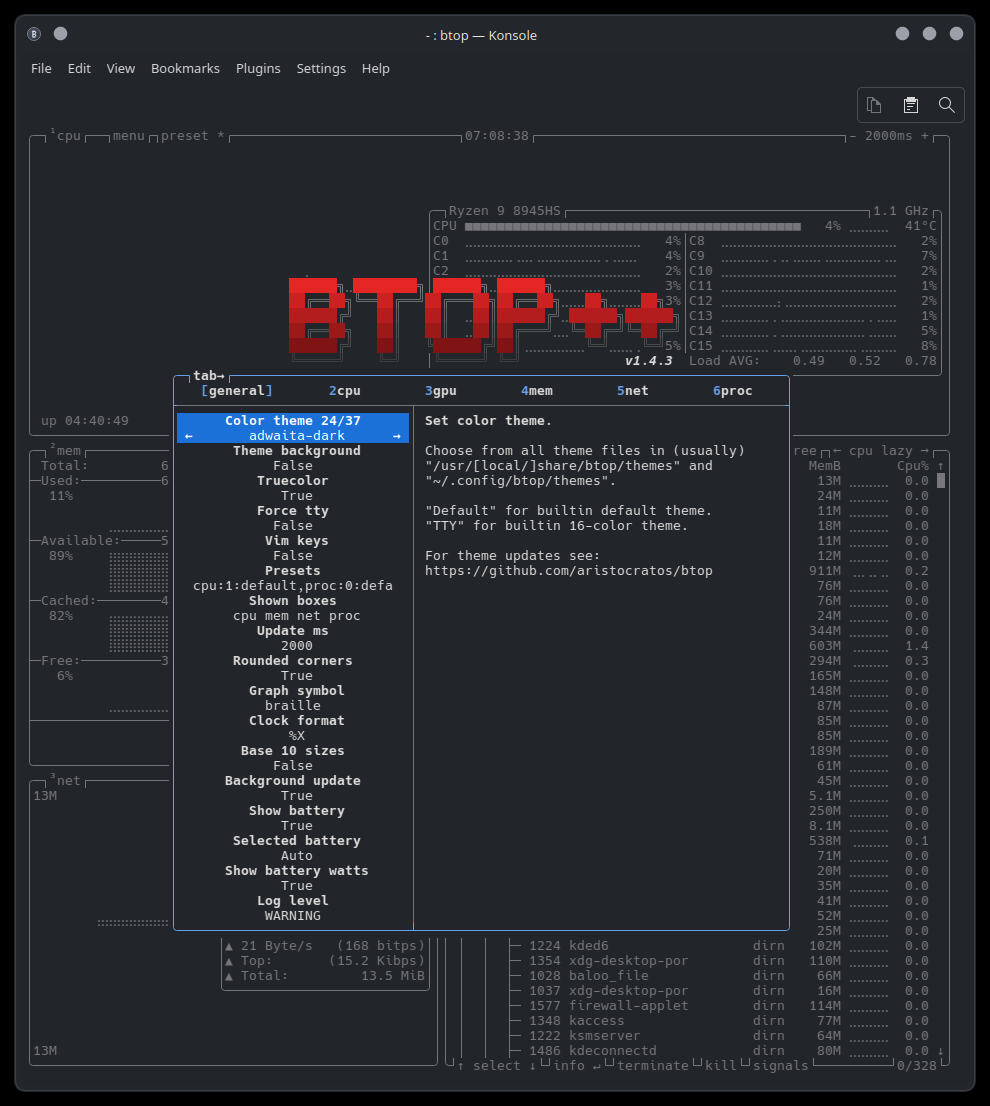
looks great. It told me to make it “80X24” or something like that for “proper viewing.” But it skips that now and shows the very lo-res interface. Yours is dialed in nicely.
this is the window settings I have in my Alacritty.toml but I also have a 24 inch monitor @ 1080
[window]
dynamic_padding = false
title = "Alacritty"

[window.class]
general = "Alacritty"
instance = "Alacritty"

[window.dimensions]
columns = 140
lines = 38

[window.padding]
x = 4
y = 4

[window.position]
x = 325
y = 110
1 Like
I cut and paste your window dimensions then dialed it in for my own 24".
BTOP is crisper now–thanks for your help.
1 Like
AI generated?
Did you write that out yourself or was it AI?
I also prefer a vertical window.
echo $COLUMNS
96
echo $LINES
48
1 Like
The btop started crashing on my PC when I replaced the AMD GPU with a another AMD GPU.
With AMD Radeon VII, in btop, when I hit P to change to the next page of information, btop will crash immediately.
Sys Info:
KDE Plasma Version: 6.4.0
KDE Frameworks Version: 6.15.0
Qt Version: 6.9.1
Kernel Version: 6.14.11-x64v2-xanmod1 (64-bit)
Graphics Platform: Wayland
Processors: 8 × Intel® Core™ i7-2600K CPU @ 3.40GHz
Memory: 16 GiB of RAM (15.5 GiB usable)
Graphics Processor 1: AMD Radeon VII
Graphics Processor 2: Mesa Intel® HD Graphics 3000