System issues with the non-LTS kernels

Hello!

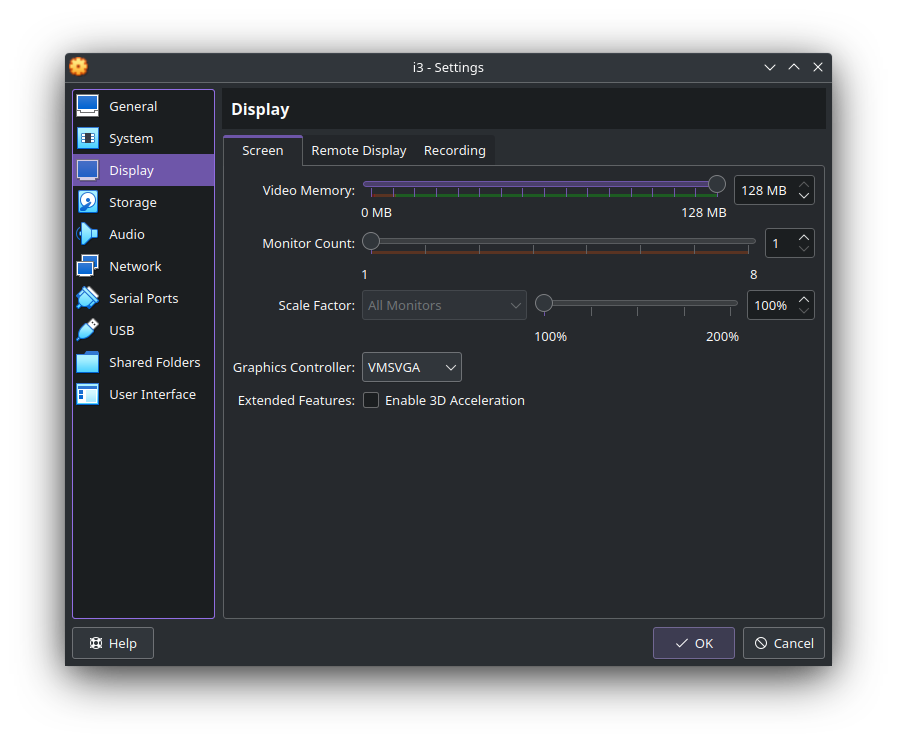
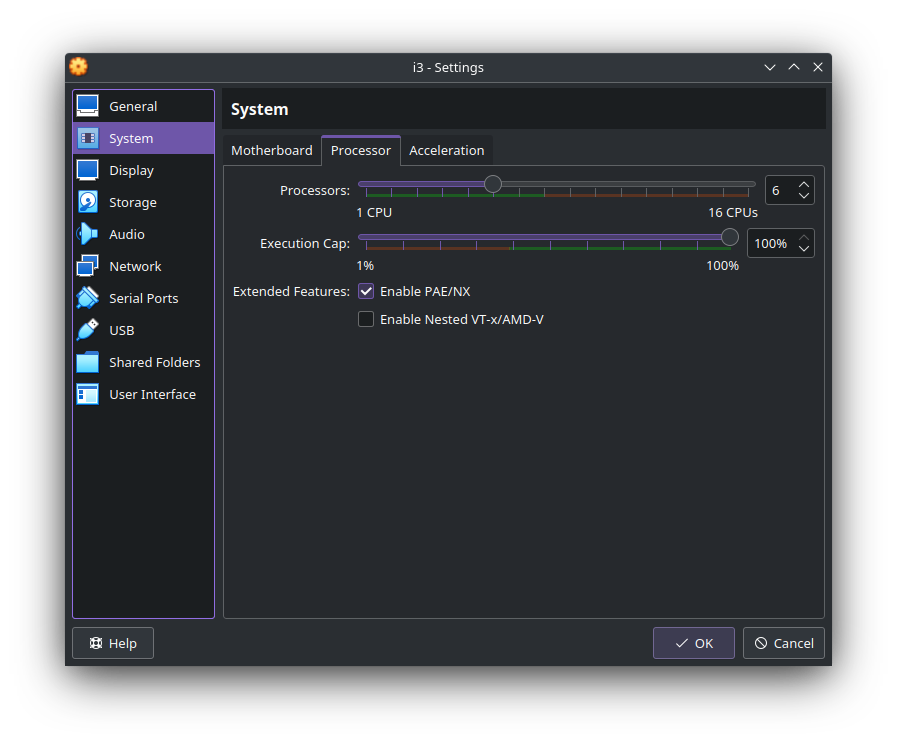
I’m running EndeavourOS + i3-wm in a virtual machine, and recently began experiencing issues with the kernel and install as a whole. On boot, the system hangs on “Loading initial ramdisk” for a good several minutes, and when I it does get to the desktop, htop states that the main Xorg process uses between 200% and 400% of my CPU (I’ve given the system 8 threads). Both the 6.0.12 Linux standard kernel bundled with the latest Endeavour install and the 6.1.10 Zen kernel acted the same way, as did booting from the “fallback initramfs” using GRUB.

Searching the problem told me to reinstall the kernels and regenerate the ramdisks, which I did through a chroot operation, but it seemed to have no effect. I then installed the LTS kernel, and it booted almost immediately and Xorg went down to an average usage of 60%. Any clue why this might be happening? I hope the answer isn’t a “well the LTS kernel is meant to be more stable,” as the difference in boot speed is enormous, especially with the revision of the kernel that came with Endeavour.

Thanks for the answers!

Can we see the output of inxi -Fxxxz

Booting using the LTS kernel, the result is as follows:

System:
  Kernel: 5.15.91-4-lts arch: x86_64 bits: 64 compiler: gcc v: 12.2.1
    Desktop: i3 v: 4.22 info: i3bar vt: 7 dm: LightDM v: 1.32.0
    Distro: EndeavourOS base: Arch Linux
Machine:
  Type: Virtualbox System: innotek GmbH product: VirtualBox v: 1.2
    serial: <superuser required> Chassis: Oracle Corporation type: 1
    serial: <superuser required>
  Mobo: Oracle model: VirtualBox v: 1.2 serial: <superuser required>
    BIOS: innotek GmbH v: VirtualBox date: 12/01/2006
Battery:
  ID-1: BAT0 charge: 40.0 Wh (80.0%) condition: 50.0/50.0 Wh (100.0%)
    volts: 10.0 min: 10.0 model: innotek 1 type: Unknown serial: N/A status: N/A
CPU:
  Info: 8-core model: AMD Ryzen 7 5700U with Radeon Graphics bits: 64
    type: MCP smt: <unsupported> arch: Zen 2 rev: 1 cache: L1: 512 KiB L2: 4 MiB
    L3: 8 MiB
  Speed (MHz): avg: 1797 min/max: N/A cores: 1: 1797 2: 1797 3: 1797 4: 1797
    5: 1797 6: 1797 7: 1797 8: 1797 bogomips: 28745
  Flags: ht lm nx pae sse sse2 sse3 sse4_1 sse4_2 sse4a ssse3
Graphics:
  Device-1: VMware SVGA II Adapter driver: vmwgfx v: 2.19.0.0 ports:
    active: Virtual-1 empty: Virtual-2, Virtual-3, Virtual-4, Virtual-5,
    Virtual-6, Virtual-7, Virtual-8 bus-ID: 00:02.0 chip-ID: 15ad:0405
    class-ID: 0300
  Display: x11 server: X.Org v: 21.1.7 compositor: Picom v: git-b700a
    driver: X: loaded: vmware unloaded: modesetting alternate: fbdev,vesa
    gpu: vmwgfx display-ID: :0 screens: 1
  Screen-1: 0 s-res: 1600x1200 s-dpi: 97 s-size: 421x316mm (16.57x12.44")
    s-diag: 526mm (20.72")
  Monitor-1: Virtual-1 mapped: Virtual1 res: 1600x1200 hz: 60 size: N/A
    modes: max: 800x600 min: 640x480
  API: OpenGL v: 4.5 Mesa 22.3.4 renderer: llvmpipe (LLVM 15.0.7 128 bits)
    direct-render: Yes
Audio:
  Device-1: Intel 82801AA AC97 Audio vendor: Dell driver: snd_intel8x0
    v: kernel bus-ID: 00:05.0 chip-ID: 8086:2415 class-ID: 0401
  Sound API: ALSA v: k5.15.91-4-lts running: yes
  Sound Server-1: PulseAudio v: 16.1 running: no
  Sound Server-2: PipeWire v: 0.3.65 running: yes
Network:
  Device-1: Intel 82540EM Gigabit Ethernet driver: e1000 v: kernel port: d020
    bus-ID: 00:03.0 chip-ID: 8086:100e class-ID: 0200
  IF: enp0s3 state: up speed: 1000 Mbps duplex: full mac: <filter>
  Device-2: Intel 82371AB/EB/MB PIIX4 ACPI type: network bridge
    driver: piix4_smbus v: N/A port: N/A bus-ID: 00:07.0 chip-ID: 8086:7113
    class-ID: 0680
Drives:
  Local Storage: total: 64 GiB used: 5.2 GiB (8.1%)
  ID-1: /dev/sda vendor: VirtualBox model: VBOX HARDDISK size: 64 GiB
    speed: 3.0 Gb/s type: N/A serial: <filter> rev: 1.0 scheme: MBR
Partition:
  ID-1: / size: 56.39 GiB used: 5.2 GiB (9.2%) fs: ext4 dev: /dev/sda1
Swap:
  ID-1: swap-1 type: partition size: 6.4 GiB used: 0 KiB (0.0%) priority: -2
    dev: /dev/sda2
Sensors:
  Src: lm-sensors+/sys Message: No sensor data found using /sys/class/hwmon
    or lm-sensors.
Info:
  Processes: 190 Uptime: 2m wakeups: 126 Memory: 7.76 GiB
  used: 583.6 MiB (7.3%) Init: systemd v: 252 default: graphical Compilers:
  gcc: 12.2.1 Packages: pm: pacman pkgs: 814 Shell: Bash v: 5.1.16
  running-in: xfce4-terminal inxi: 3.3.25

You are not running it on bare metal but in a VM. Could that be the issue?

That’s right, as stated, I am running this in a virtual machine. This issue only cropped up yesterday, and before that I was booting perfectly fine from the Zen kernel.

Virtualbox is a mess with current kernels/drivers. Try removing picom and see if that resolves your high usage issues.

Removing picom didn’t affect the Xorg task’s usage by much. The main issue is the abysmal boot time with the Zen/vanilla kernels, I just thought mentioning that Xorg being slower too might help identify the issue.

Can you boot off of one of those kernels and then run systemd-analyze critical-chain

1 Like

Output on 6.1.10zen:

graphical.target @48.583s
└─lightdm.service @46.408s +2.154s
└─systemd-user-sessions.service @45.341s +757ms
└─network.target @44.963s
└─NetworkManager.service @43.223s +1.714s
└─network-pre.target @43.160s
└─firewalld.service @39.215s +3.911s
└─dbus.service @29.403s +8.801s
└─basic.target @29.050s
└─sockets.target @29.045s
└─dbus.socket @29.044s
└─sysinit.target @28.844s
└─systemd-update-done.service @27.891s +943ms
└─systemd-journal-catalog-update.service @25.694s +1.795s
└─systemd-tmpfiles-setup.service @20.401s +5.126s
└─local-fs.target @20.157s
└─run-credentials-systemd\x2dtmpfiles\x2dsetup.service.mount @20.957s
└─local-fs-pre.target @9.039s
└─systemd-tmpfiles-setup-dev.service @8.399s +594ms
└─systemd-sysusers.service @6.514s +1.784s
└─systemd-remount-fs.service @3.348s +2.126s
└─systemd-journald.socket @2.565s
└─-.mount @2.490s
└─-.slice @2.489s

I have i3 installed in v-box and have no issues on either kernel.

systemd-analyze critical-chain

graphical.target @4.790s
└─multi-user.target @4.790s
└─cups.service @4.747s +41ms
└─nss-user-lookup.target @4.792s
[ricklinux@i3-vbox ~]$

Virtualbox settings

Edit:

[ricklinux@i3-vbox ~]$ systemctl status | eos-sendlog
https://0x0.st/HrsP.txt
[ricklinux@i3-vbox ~]$ 
[ricklinux@i3-vbox ~]$ systemctl --failed
  UNIT LOAD ACTIVE SUB DESCRIPTION
0 loaded units listed.
[ricklinux@i3-vbox ~]$ 

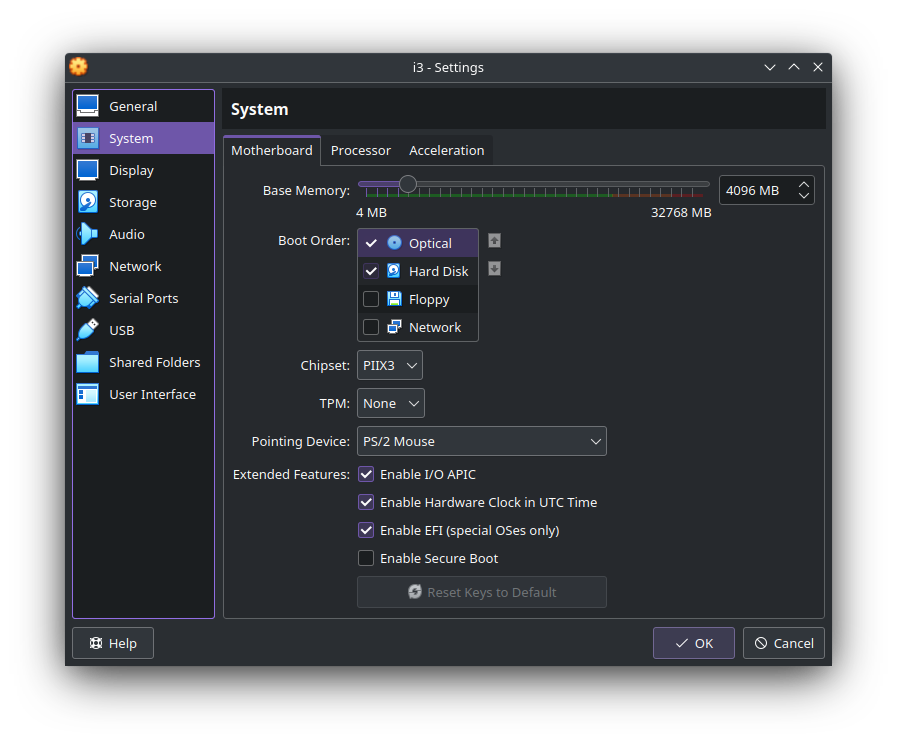
Our configurations are pretty much identical except mine is BIOS and yours is UEFI. Might that be causing issues with newer kernels? I’ll try the systemctl --failed and get back to you on that.

I don’t think that it should. I’m not sure why your output for systemd-analyze critical-chain is so long? Mine is instant with hardly any output. Do you have all these things set up after as mine i just installed it to check.

Your host isn’t Bios? Is the v-box install of i3 in Bios mode? Is that what you mean?

Edit: This is the reason I’m asking? Because bios doesn’t have systemd boot. So why you said you did this? Is this something you did on your host?

Edit: I installed i3 in Bios mode and is the same. No issue booting either kernels.

graphical.target @4.700s
└─multi-user.target @4.700s
  └─cups.service @4.614s +83ms
    └─nss-user-lookup.target @4.700s
[ricklinux@rick-virtualbox ~]$ 

Your host isn’t Bios? Is the v-box install of i3 in Bios mode? Is that what you mean?

Host is UEFI, guest is BIOS.

It’s strange why the systemd-analyze critical-chain output is so long, I don’t even recognize half of the programs. Running systemctl --failed gave me the same thing you got. This particular VM is only a few days old, and this issue didn’t crop up immediately after install; it booted fine from the zen kernel for a period of time, and I didn’t make any drastic changes before it broke.

Interesting extra nugget; the critical chain when booting with 5.19.91-4-lts is much, much smaller.

graphical.target @16.742s
└─lightdm.service @16.240s +501ms
└─systemd-user-sessions.service @16.091s +125ms
└─nss-user-lookup.target @16.792s

Rick, even your load times module-for-module are faster than mine; what’s your host CPU?

I have installed it on v-box in both uefi and bios mode. My host is Ryzen 3800X uefi with amdgpu which makes no difference to v-box.

Edit: I am also curious why you have so much more output on that command? Is that with the zen kernel or just the current kernel?

As stated, that’s with the 6.1.10-zen kernel that I reinstalled manually after the issue started appearing.

I don’t have a copy of the 6.0.12 vanilla kernel on the system anymore; do you want me to try reinstalling it and regenerating the ramdisk to investigate that further?

I was just wondering if it was on zen because i don’t have that output?

Yes, it is latest zen.

Do you get the same output then from the current 6.1.10 kernel?