Random lag in interface

This seems to have just happened with a recent update, not sure. As of about a few days ago.

Just generally using the interface, any program, the computer stops responding for like half a second or a full second, then resumes. Annoyingly, it doesn’t buffer the mouse clicks, so when clicking around files and folders, it’s annoying having to wait and then nothing happens, and then trying again.

It does buffer the keyboard input though, so when I’m typing in the Kate text editor, if nothing happens for a bit, I wait and the line of text I typed will appear.

I would say this happens fairly frequently, like, every 10 seconds, though at random.

Music continues to play uninterrupted in the background.

Does this sound like any known issue?

Is there any profiling software I can use that would show a lag spike, perhaps in CPU usage, or maybe even HDD access?

Happened to me one time two days before after my reinstallation of eos with Plasma. I have no idea what this could be due to. I went to the terminal via ctrl and F1 or F2 and rebooted. Never happened again since then

Ah ok, I’ve rebooted many times, and I just did another update (with yay) and rebooted again, and the issue still persists.

Im sorry, i cant help you further. Maybe someone will come along who has the same thing as you

Can you please share some information about your system by using this command

sudo inxi -SMCGDmsxx --za
1 Like

Oh sorry, of course;

System:
  Kernel: 6.14.2-arch1-1 arch: x86_64 bits: 64 compiler: gcc v: 14.2.1
  Desktop: KDE Plasma v: 6.3.4 tk: Qt v: N/A wm: kwin_x11 dm: SDDM
    Distro: EndeavourOS base: Arch Linux
Machine:
  Type: Desktop Mobo: ASUSTeK model: Z170-AR v: Rev 1.xx serial: <filter>
    part-nu: SKU UEFI: American Megatrends v: 3801 date: 03/14/2018
Memory:
  System RAM: total: 32 GiB available: 31.28 GiB used: 3.55 GiB (11.3%)
  Array-1: capacity: 64 GiB slots: 4 modules: 4 EC: None
    max-module-size: 16 GiB note: est.
  Device-1: ChannelA-DIMM1 type: DDR4 size: 8 GiB speed: 2400 MT/s
    volts: 1.2 manufacturer: Kingston part-no: KHX2400C15D4/8G
  Device-2: ChannelA-DIMM2 type: DDR4 size: 8 GiB speed: 2400 MT/s
    volts: 1.2 manufacturer: Kingston part-no: KHX2400C15/8G
  Device-3: ChannelB-DIMM1 type: DDR4 size: 8 GiB speed: 2400 MT/s
    volts: 1.2 manufacturer: Kingston part-no: KHX2400C15D4/8G
  Device-4: ChannelB-DIMM2 type: DDR4 size: 8 GiB speed: 2400 MT/s
    volts: 1.2 manufacturer: Kingston part-no: KHX2400C15/8G
CPU:
  Info: quad core model: Intel Core i7-6700K bits: 64 type: MT MCP
    arch: Skylake-S rev: 3 cache: L1: 256 KiB L2: 1024 KiB L3: 8 MiB
  Speed (MHz): avg: 4201 min/max: 800/4200 cores: 1: 4201 2: 4201 3: 4201
    4: 4201 5: 4201 6: 4201 7: 4201 8: 4201 bogomips: 63999
  Flags: avx avx2 ht lm nx pae sse sse2 sse3 sse4_1 sse4_2 ssse3
Graphics:
  Device-1: NVIDIA TU106 [GeForce RTX 2060 SUPER] vendor: Gigabyte
    driver: nvidia v: 570.133.07 arch: Turing pcie: speed: 8 GT/s lanes: 16
    ports: active: none off: HDMI-A-1,HDMI-A-2,HDMI-A-3 empty: DP-1,Unknown-2
    bus-ID: 01:00.0 chip-ID: 10de:1f06
  Device-2: Logitech Webcam C210 driver: snd-usb-audio,uvcvideo type: USB
    rev: 2.0 speed: 480 Mb/s lanes: 1 bus-ID: 1-9:4 chip-ID: 046d:0819
  Display: unspecified server: X.Org v: 21.1.16 with: Xwayland v: 24.1.6
    compositor: kwin_x11 driver: X: loaded: nvidia unloaded: modesetting
    alternate: fbdev,nouveau,nv,vesa gpu: nvidia,nvidia-nvswitch
    display-ID: :0 screens: 1
  Screen-1: 0 s-res: 4966x1200 s-dpi: 93
  Monitor-1: HDMI-A-1 mapped: HDMI-0 note: disabled pos: left
    model: LG (GoldStar) 19EN33 res: 1366x768 hz: 60 dpi: 85 diag: 470mm (18.5")
  Monitor-2: HDMI-A-2 mapped: HDMI-1 note: disabled pos: primary,center
    model: Dell U2412M res: 1920x1200 hz: 60 dpi: 94 diag: 611mm (24.1")
  Monitor-3: HDMI-A-3 mapped: HDMI-2 note: disabled pos: right
    model: Dell E207WFP res: 1680x1050 hz: 60 dpi: 99 diag: 508mm (20")
  API: EGL v: 1.5 platforms: device: 0 drv: nvidia device: 1 drv: nouveau
    device: 2 drv: swrast gbm: drv: nvidia surfaceless: drv: nvidia x11:
    drv: nvidia inactive: wayland
  API: OpenGL v: 4.6.0 compat-v: 4.5 vendor: nvidia mesa v: 570.133.07
    glx-v: 1.4 direct-render: yes renderer: NVIDIA GeForce RTX 2060
    SUPER/PCIe/SSE2
  API: Vulkan v: 1.4.309 surfaces: xcb,xlib device: 0 type: discrete-gpu
    driver: N/A device-ID: 10de:1f06
  Info: Tools: api: clinfo, eglinfo, glxinfo, vulkaninfo
    de: kscreen-console,kscreen-doctor gpu: nvidia-smi wl: wayland-info
    x11: xdpyinfo, xprop, xrandr
Drives:
  Local Storage: total: 9.55 TiB used: 8.24 TiB (86.3%)
  ID-1: /dev/nvme0n1 vendor: Samsung model: SSD 970 EVO 500GB
    size: 465.76 GiB speed: 31.6 Gb/s lanes: 4 serial: <filter> temp: 35.9 C
  ID-2: /dev/sda vendor: Samsung model: SSD 870 EVO 1TB size: 931.51 GiB
    speed: 6.0 Gb/s serial: <filter>
  ID-3: /dev/sdb vendor: Seagate model: ST4000VN008-2DR166 size: 3.64 TiB
    speed: 6.0 Gb/s serial: <filter>
  ID-4: /dev/sdc vendor: Seagate model: ST2000DL003-9VT166 size: 1.82 TiB
    speed: 6.0 Gb/s serial: <filter>
  ID-5: /dev/sdd vendor: Seagate model: ST3000DM007-1WY10G size: 2.73 TiB
    speed: 6.0 Gb/s serial: <filter>
Sensors:
  System Temperatures: cpu: 32.0 C mobo: N/A
  Fan Speeds (rpm): N/A

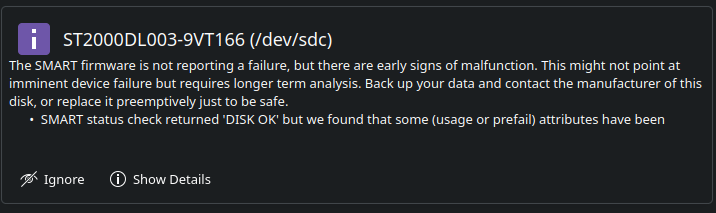
Well I can see you got some dated hardware there on the HDD side of things.
Especially the ID-4: /dev/sdc vendor: Seagate model: ST2000DL003-9VT166 size: 1.82 TiBdrive that seems to have been available since end 2010 (not saying you bought it back than, but still).
So it might be a good idea to do have a look at the smart status of the drives.

This is the only one that doesn’t report as “OK”

smartctl 7.4 2023-08-01 r5530 [x86_64-linux-6.14.2-arch1-1] (local build)
Copyright (C) 2002-23, Bruce Allen, Christian Franke, www.smartmontools.org

=== START OF INFORMATION SECTION ===
Model Family:     Seagate Barracuda Green (AF)
Device Model:     ST2000DL003-9VT166
Serial Number:    6YD03G0C
LU WWN Device Id: 5 000c50 032f8251b
Firmware Version: CC32
User Capacity:    2,000,398,934,016 bytes [2.00 TB]
Sector Size:      512 bytes logical/physical
Rotation Rate:    5900 rpm
Device is:        In smartctl database 7.3/5528
ATA Version is:   ATA8-ACS T13/1699-D revision 4
SATA Version is:  SATA 3.0, 6.0 Gb/s (current: 6.0 Gb/s)
Local Time is:    Sun Apr 13 15:54:54 2025 AEST
SMART support is: Available - device has SMART capability.
SMART support is: Enabled

=== START OF READ SMART DATA SECTION ===
SMART overall-health self-assessment test result: PASSED
See vendor-specific Attribute list for marginal Attributes.

General SMART Values:
Offline data collection status:  (0x82)	Offline data collection activity
					was completed without error.
					Auto Offline Data Collection: Enabled.
Self-test execution status:      (   0)	The previous self-test routine completed
					without error or no self-test has ever 
					been run.
Total time to complete Offline 
data collection: 		(  612) seconds.
Offline data collection
capabilities: 			 (0x7b) SMART execute Offline immediate.
					Auto Offline data collection on/off support.
					Suspend Offline collection upon new
					command.
					Offline surface scan supported.
					Self-test supported.
					Conveyance Self-test supported.
					Selective Self-test supported.
SMART capabilities:            (0x0003)	Saves SMART data before entering
					power-saving mode.
					Supports SMART auto save timer.
Error logging capability:        (0x01)	Error logging supported.
					General Purpose Logging supported.
Short self-test routine 
recommended polling time: 	 (   1) minutes.
Extended self-test routine
recommended polling time: 	 ( 338) minutes.
Conveyance self-test routine
recommended polling time: 	 (   2) minutes.
SCT capabilities: 	       (0x30b7)	SCT Status supported.
					SCT Feature Control supported.
					SCT Data Table supported.

SMART Attributes Data Structure revision number: 10
Vendor Specific SMART Attributes with Thresholds:
ID# ATTRIBUTE_NAME          FLAG     VALUE WORST THRESH TYPE      UPDATED  WHEN_FAILED RAW_VALUE
  1 Raw_Read_Error_Rate     0x000f   114   099   006    Pre-fail  Always       -       68070832
  3 Spin_Up_Time            0x0003   092   092   000    Pre-fail  Always       -       0
  4 Start_Stop_Count        0x0032   088   088   020    Old_age   Always       -       12839
  5 Reallocated_Sector_Ct   0x0033   100   100   036    Pre-fail  Always       -       0
  7 Seek_Error_Rate         0x000f   085   060   030    Pre-fail  Always       -       385987366
  9 Power_On_Hours          0x0032   028   028   000    Old_age   Always       -       63452
 10 Spin_Retry_Count        0x0013   100   100   097    Pre-fail  Always       -       0
 12 Power_Cycle_Count       0x0032   090   090   020    Old_age   Always       -       10754
183 Runtime_Bad_Block       0x0032   100   100   000    Old_age   Always       -       0
184 End-to-End_Error        0x0032   100   100   099    Old_age   Always       -       0
187 Reported_Uncorrect      0x0032   100   100   000    Old_age   Always       -       0
188 Command_Timeout         0x0032   100   092   000    Old_age   Always       -       51540394355
189 High_Fly_Writes         0x003a   072   072   000    Old_age   Always       -       28
190 Airflow_Temperature_Cel 0x0022   074   039   045    Old_age   Always   In_the_past 26 (0 215 26 26 0)
191 G-Sense_Error_Rate      0x0032   100   100   000    Old_age   Always       -       0
192 Power-Off_Retract_Count 0x0032   100   100   000    Old_age   Always       -       846
193 Load_Cycle_Count        0x0032   094   094   000    Old_age   Always       -       13065
194 Temperature_Celsius     0x0022   026   061   000    Old_age   Always       -       26 (0 15 0 0 0)
195 Hardware_ECC_Recovered  0x001a   018   004   000    Old_age   Always       -       68070832
197 Current_Pending_Sector  0x0012   100   100   000    Old_age   Always       -       0
198 Offline_Uncorrectable   0x0010   100   100   000    Old_age   Offline      -       0
199 UDMA_CRC_Error_Count    0x003e   200   200   000    Old_age   Always       -       513
240 Head_Flying_Hours       0x0000   100   253   000    Old_age   Offline      -       63893 (121 226 0)
241 Total_LBAs_Written      0x0000   100   253   000    Old_age   Offline      -       3135144350
242 Total_LBAs_Read         0x0000   100   253   000    Old_age   Offline      -       2344358332

SMART Error Log Version: 1
No Errors Logged

SMART Self-test log structure revision number 1
No self-tests have been logged.  [To run self-tests, use: smartctl -t]

SMART Selective self-test log data structure revision number 1
 SPAN  MIN_LBA  MAX_LBA  CURRENT_TEST_STATUS
    1        0        0  Not_testing
    2        0        0  Not_testing
    3        0        0  Not_testing
    4        0        0  Not_testing
    5        0        0  Not_testing
Selective self-test flags (0x0):
  After scanning selected spans, do NOT read-scan remainder of disk.
If Selective self-test is pending on power-up, resume after 0 minute delay.

The above only provides legacy SMART information - try 'smartctl -x' for more

Well I don’t know if there is any important data on that drive , but I would back it up as soon as possible. The early signs may point to some flaws on the drive, or maybe even some bit rot.
Running a deeper smart control test might more or less destroy your data, so as I said before you do that, back up your data.

Will do, I’ve been burned by that before.

I guess to find out if it’s responsible for the hitches, I’ll have to pull it out and see if they persist. May be unrelated entirely.

Well it might be not related but running older hardware anything could cause it.

I like to think I’m not an “outlier” by “running older hardware” :laughing: I thought one of the best things about Linux is that it is good for exactly that…

I understand I need to keep on top of it though. Thanks for the tips about checking the drives.

On which drive/s do you have your OS and user profile installed? Is it your 970 EVO SSD? That would be ideal.

The Seagate drives, for the sake of performance, should be reserved for non-OS / user profile data.

Yep that’s why I bought it.
It’s not those kind of lags, it’s a full interface lockup, feels quite buggy.

Eg. if it were a performance bottleneck, particularly the HDD, I would expect the file explorer to hitch when I opened a folder, but not while typing text in to Kate. This lock up affects every program, the entire interface.

You could have top running in a visible window, and just monitor what jumps to the top when the lag happens.

top

Thanks, I didn’t know about that one, I was trying htop and couldn’t see anything obvious, like, Kate itself would jump to the top. Which isn’t helpful. But I would get the same lockup in, say, Discord or anything else.

BUT… today the problem isn’t there. So I’ll keep an eye on it.

Thing is, the lock up is like 1 or 2 seconds at a time. Not sure top refreshes fast enough to catch that momentary spike. What I’d need is something that shows a performance graph and I could click on the spike and see the program name that caused the spike. Do we have anything like that?

You could also try System Monitor, which does have graphing, but as far as I can tell, won’t let you hone in on a spike to get details. It may yet provide an idea of what resource is being maxed though. Eg: GPU, memory, CPU, etc.

Yeah I did try that back when, I did notice some of the CPU cores having a little spike up to 200%, no idea what it was, not too helpful.

So I have taken a look at the Bios date of your Mobo and found that though it is from 2018 that would be the latest available. So no update would be available , but I also saw that the first Bios available was from 2015. So if I am correct the system would be from around 2015. Do you know if the PSU is from around that time also, and is a solid brand. Another thing is your PC connected directly to a (preferably grounded) wall socket , if not try to change that. The reason I am saying this is because you mentioned the 200% spike could be caused by some power peak that isn’t handled correctly by your PSU because of it’s age or something like that. To monitor your system there is something called glances that runs in the terminal and gives you a lot of info.

It’s a fairly recently replaced PSU from memory, I just checked and it’s an Antec EDGE 550 (Model: EDG550) I know it’s recent enough, there’s no way that’s an issue.

Thanks for glance, it still updates on intervals like top so no way I’d catch the 1-2 second spike without a graph I’d say.