Hello everyone, have a nice weekend. I wanted to ask if it’s possible to display the CPU’s wattage consumption and CPU fan speed on EndeavourOS with KDE Plasma.
I can’t seem to find these options among the various sensors you can configure. I can do this for the GPU, but not for the CPU.
Is there a simple way to get these two things read and put them in the widgets?
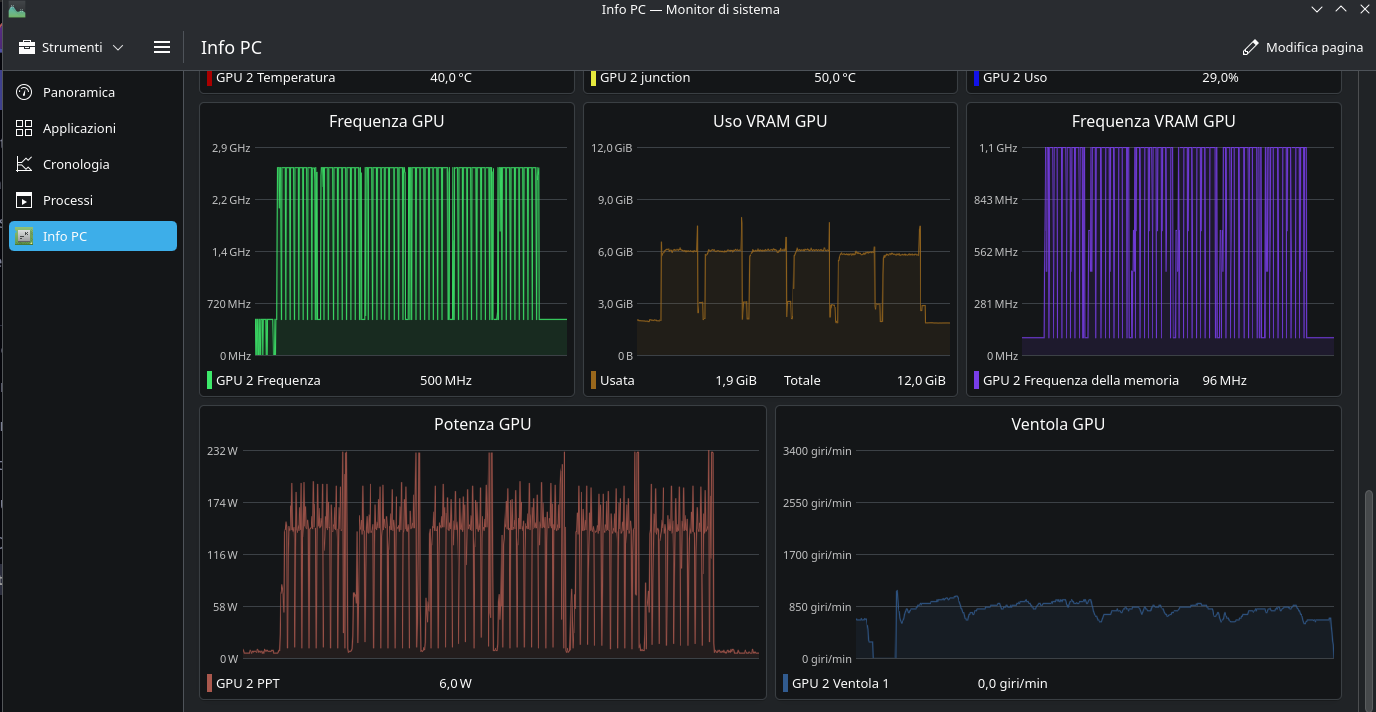
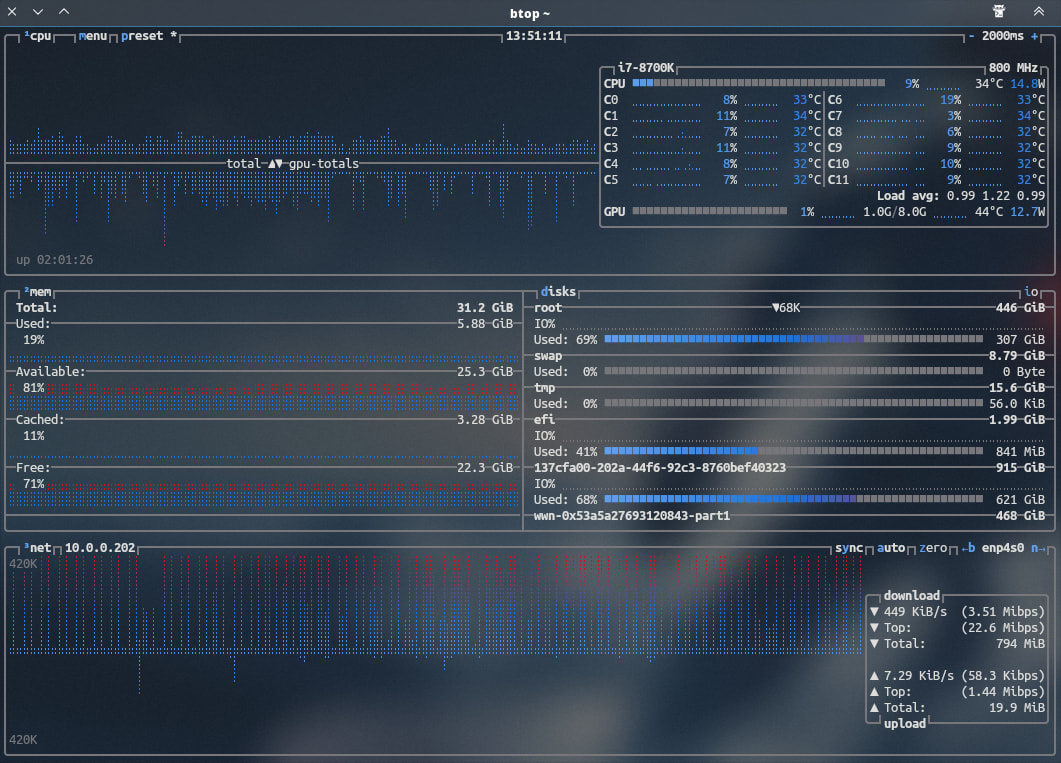
For example, in the image posted, the power consumed and the fan speed of my GPU are the last two boxes. But I don’t have these options for the CPU.
My hardware is this:
CPU: AMD Ryzen 7 5700X
MOTHERBOARD: ASUS PRIME X570-P
RAM: 64 GB
GRAPHICS CARD: AMD Radeon RX 6750 XT
I’m no expert, especially when it comes to configuring these things, so I’ll take this opportunity to learn something. Is there an easy way to get this info?
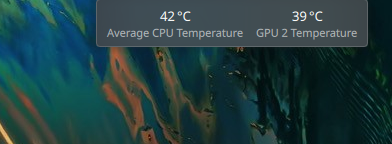
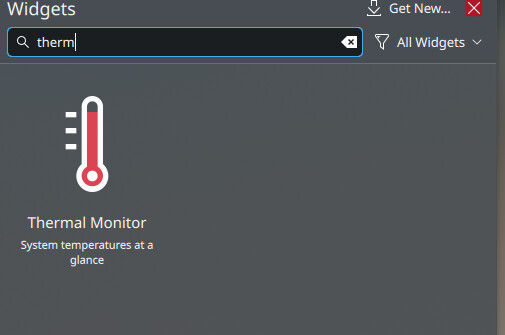
You can add the Plasma widget “Thermal Monitor” which looks like this on the desktop.
There are various sensors listed in the config. You’ll have to check which sensor lists what you’re looking for.
I’m not sure. The sensors that track CPU power and fan speeds aren’t listed in my widget (everyone’s hardware is different). BTOP++ is listed in the Extras repo and it shows my CPU wattage. https://github.com/aristocratos/btop
It’s true that everyone’s hardware is different, but for example, on the old PC where I still have EOS, which is an Intel i7-3770k and an Nvidia 980ti, I can still see the power consumption and the video card fan speed; it lets me enter them in the widget options.
Maybe it’s a question of the settings upstream of KDE with the widgets, because I can’t see the CPU power or fan speed on the old PC either.
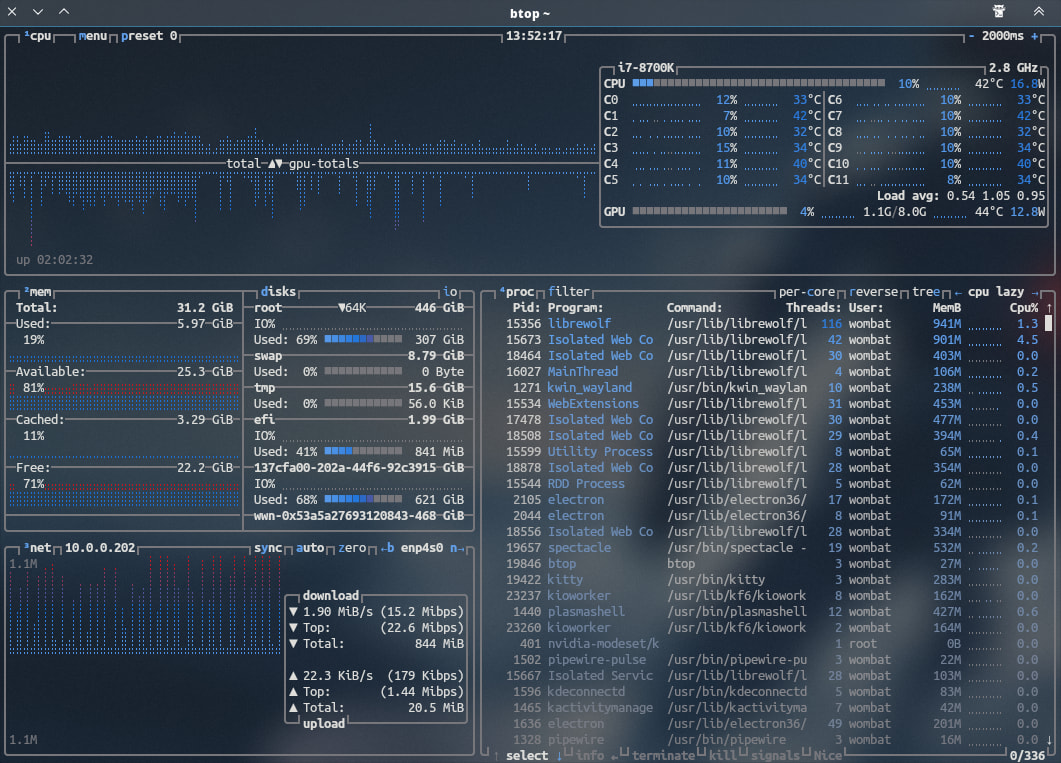
I installed btop, and at least it shows the watts. Thanks.
So, I tested it on Arch, but I didn’t touch anything on EndeavourOS.
I asked the AI, and this is what came up.
So, first I ran “sudo sensors-detect” and it said yes, then I rebooted and ran “sudo modprobe nct6775” from the terminal.
When I ran the “sensors” command, it showed all the fan channels, and the active ones showed a value.
I installed Zenpower with “yay -S zenpower3-dkms,” rebooted, and ran “sudo modprobe zenpower.”
Now it shows me the watts, even though there are two sensors to monitor to get the total watts consumed (that’s what the AI says).
The downside is that the temperature widget with the CPU->All->Maximum CPU Temperature option doesn’t work, and I have to set the sensor’s one (the Tdie).
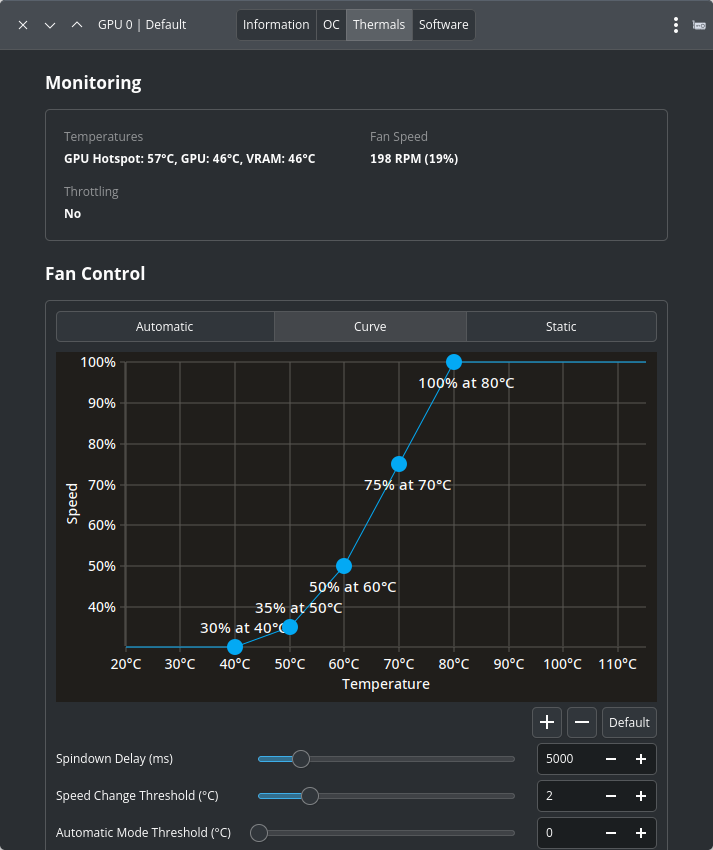
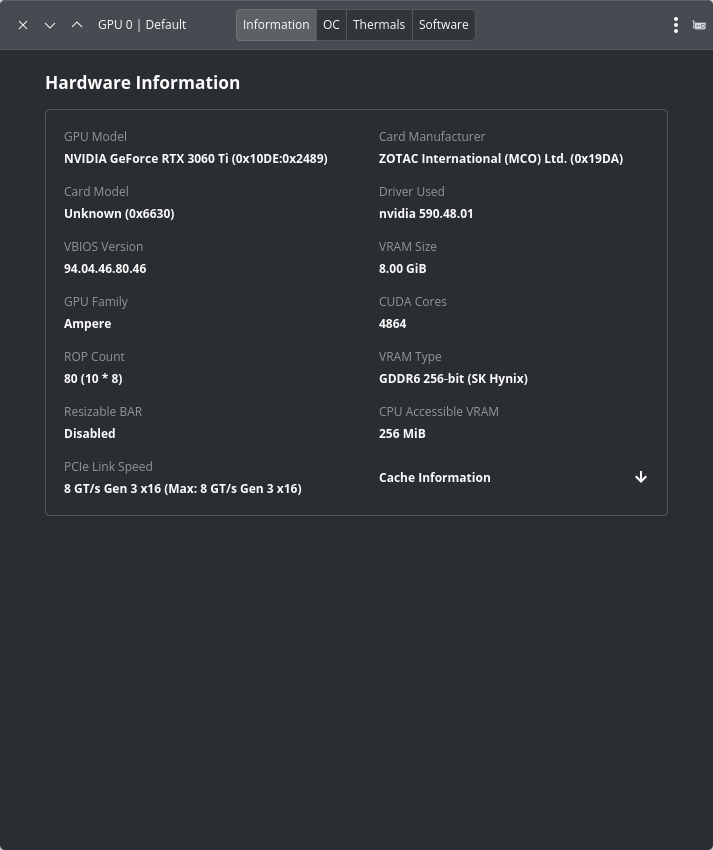
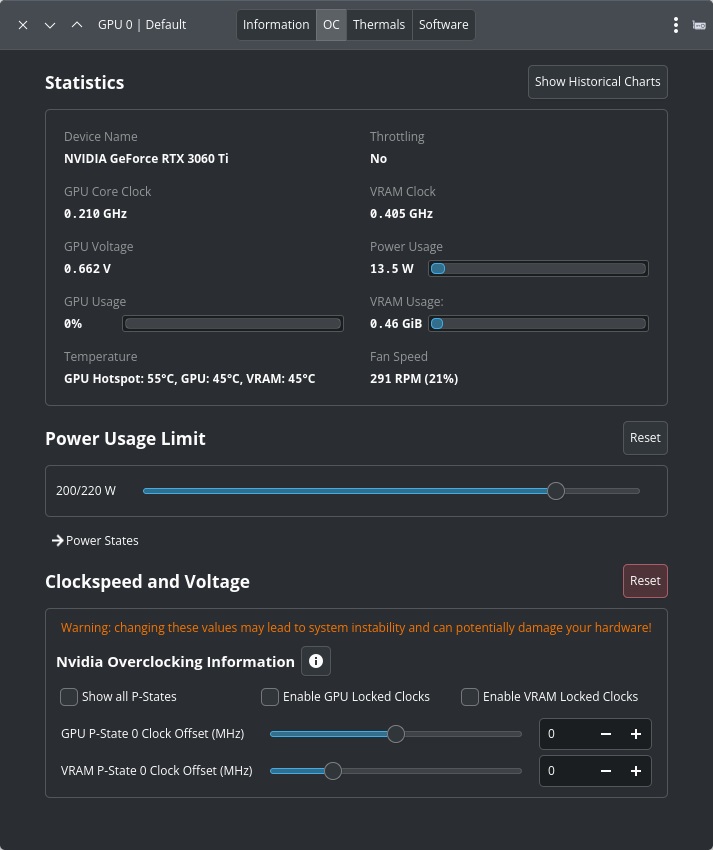
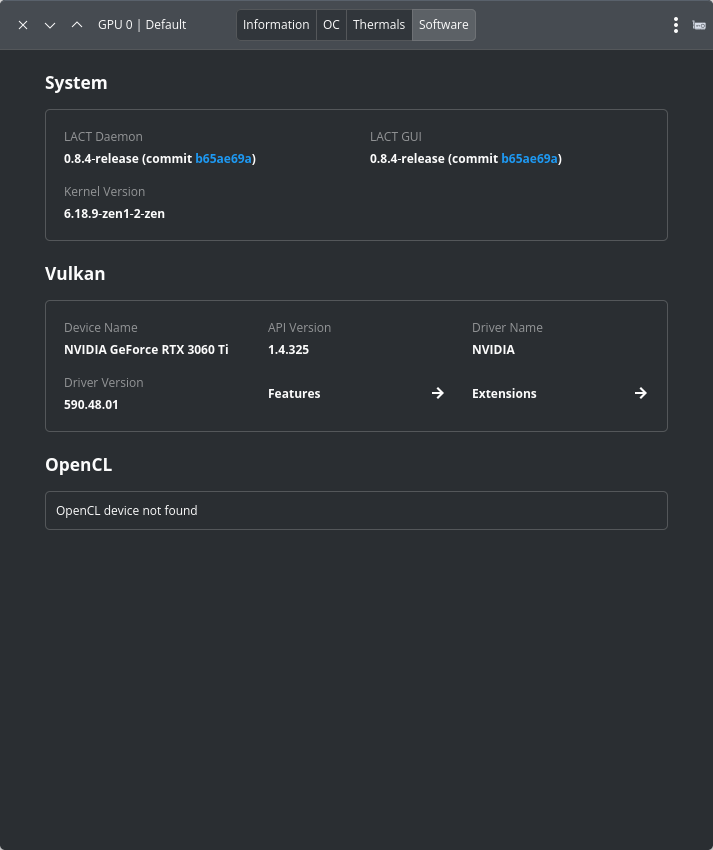
LACT is a Linux GUI application for AMD and NVIDIA GPU monitoring, overclocking, and fan control. It doesn’t manage or overclock CPUs. I’ve not found any app like LACT that manages and/or overclocks CPUs.
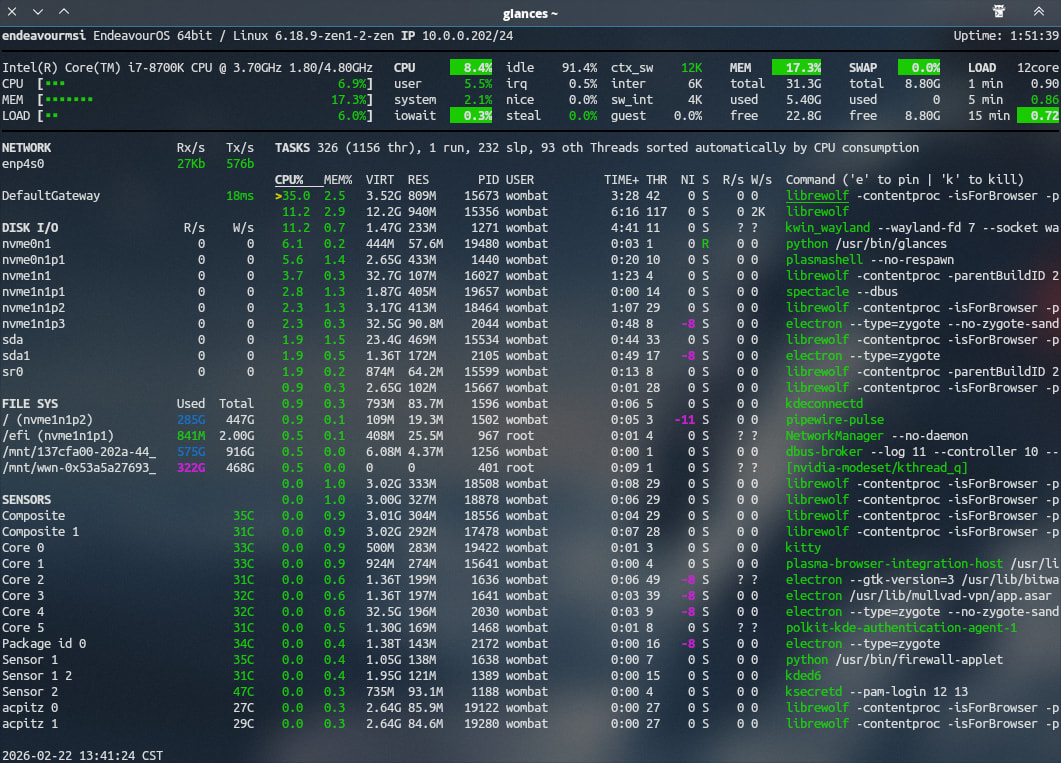
For simple CPU monitoring, there are the CLI tools Btop and Glances. Btop has various presets and is more feature-rich, while Glances is a simpler one-stop shop.
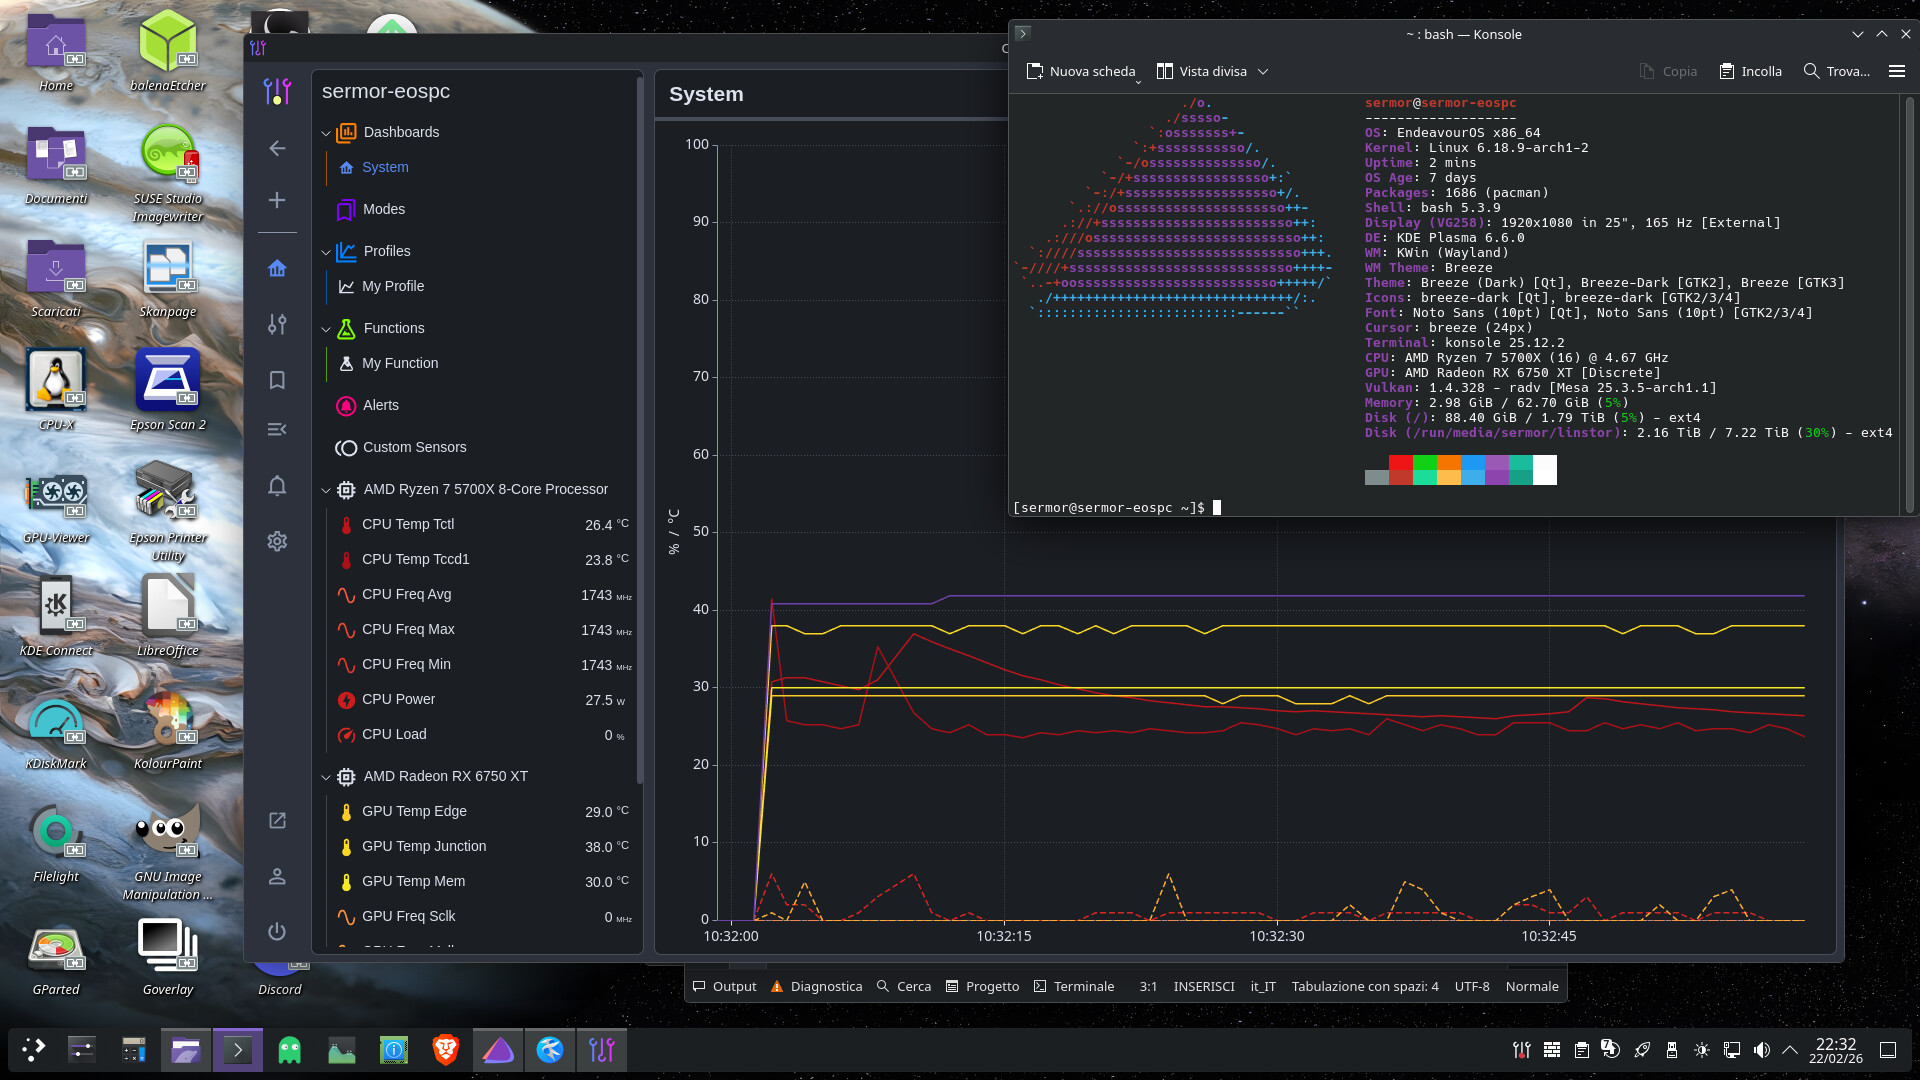
I’m on EndeavourOS. I simply installed coolercontrol, without following the steps I did on arch, and it works. It reads the CPU power value, the various temperatures, and so on.