It won’t overwrite EITHER of them! ![]() Or however many of them you split it to, nor will it matter what monitor you load 'em on…
Or however many of them you split it to, nor will it matter what monitor you load 'em on…
Saves space too (well - it can!)

It won’t overwrite EITHER of them! ![]() Or however many of them you split it to, nor will it matter what monitor you load 'em on…
Or however many of them you split it to, nor will it matter what monitor you load 'em on…
Saves space too (well - it can!)

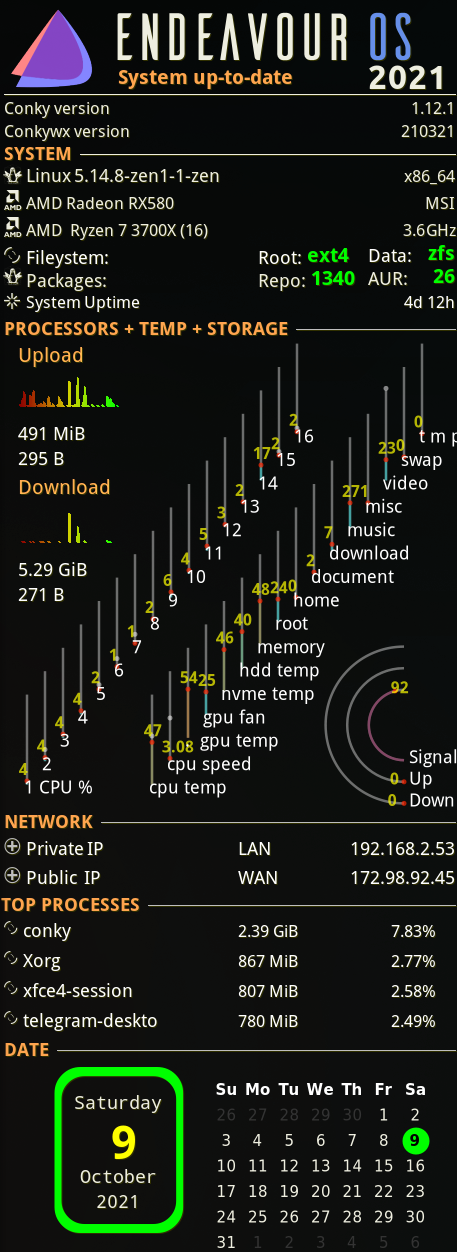
2.39 GiB? Does Conky use that much memory?
Does it depend on how many things you are monitoring?
I suppose it could (what with also multiple weather reposts, multiple scrolling lists going, an Astrolabe etc on the go - but I suspect in this case it is the 2 browsers, telegram-desktop, thunderbird, 3 games and vs-code that are the culprits! 
The pic is just a slice of the top-right main screen conky, not a full screenshot!
Alright. So it shows the mem usage for all the currently running apps? I thought it was only conky itself using so much RAM 
I read about this recently.
Supposedly even more detailed than the htop. https://htop.dev
I took a further look at it - and it might have been. After all, there are a total of 15 conky processes running at the time.
┌07:22:59 WD= [/usr/share/conkywx]
└───freebird@nest ─▶$ ps -e | grep conky | wc -l
15
and it is conceivable that conkywx got counted in there too… Can’t say as I paid it any attention before, as I have lotsa RAM, and it doesn’t hit the processor very hard (3%?) even with the 4 vertical smooth scrollers going.
Very nice.
Perfect for monitoring my VPS’s. Just replaced the old and rather complex setup (glances+influxdb+grafana) with netdata on all machines. ![]()
I use btop++ that @zoli62 already mentioned above. It gets the job done 
whats that?
a URL ![]()