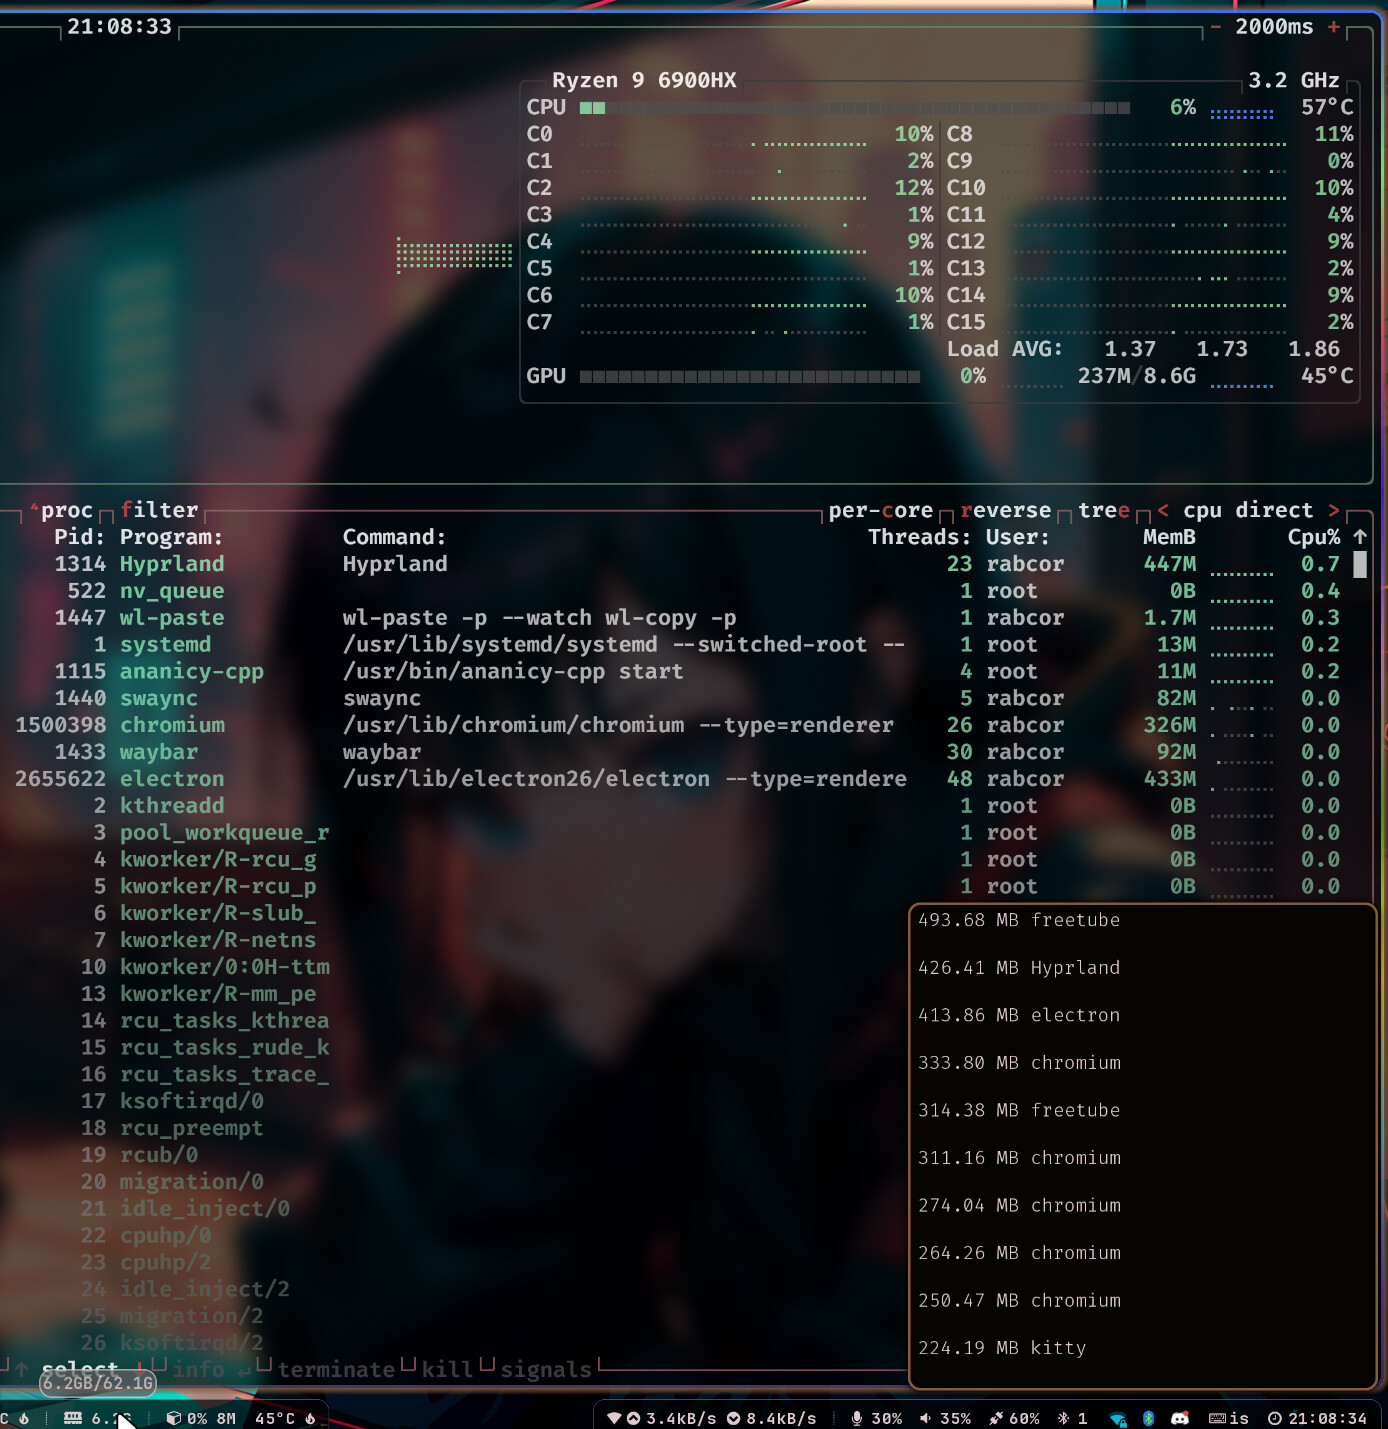
You can see here btop’s output compared to ps
exact command is
ps -o rss,comm --sort=-rss ghx
Formatted in a bash script like so:
ps -o rss,comm --sort=-rss ghx | sort -rn | head -$1 | awk '{ hr[1024**2]="GB"; hr[1024]="MB";
 for (x=1024**3; x>=1024; x/=1024) {
 if ($1>=x) { printf ("%-6.2f %s ", $1/x, hr[x]); break }
 } } { printf ("%-6s %-10s ", $2, $3) }
 { for ( x=4 ; x<=NF ; x++ ) { printf ("%s ",$x) } print ("\n") }
 '
(very handy stuff, tho it’s unfortunately relying on rss since ps doesn’t show pss yet)
As you can see btop is missing A LOT of data (ps is only showing 10 entries because it’s using head -10; i think the total number of things it shows using ram rn is somewhere around 100 entries), i noticed as time passed the list got more populated, but i don’t know it doesn’t seem very reliable, out of all the process/resource monitor cli interfaces i think btop looks the best by far though, really sexy.